Quick Links
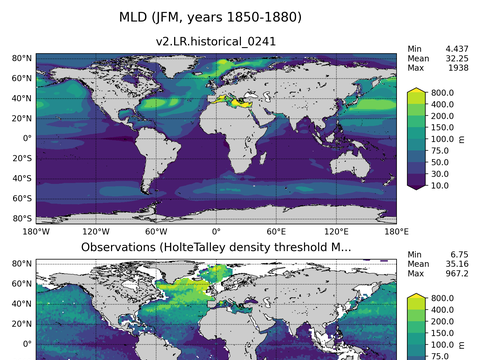
Global Mixed-Layer Depth
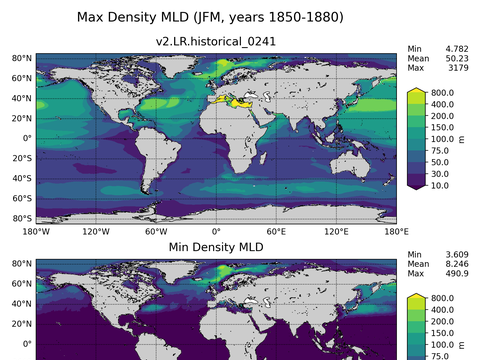
Global Min/Max Mixed-Layer Depth
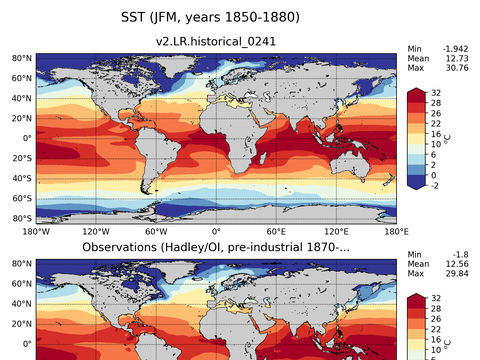
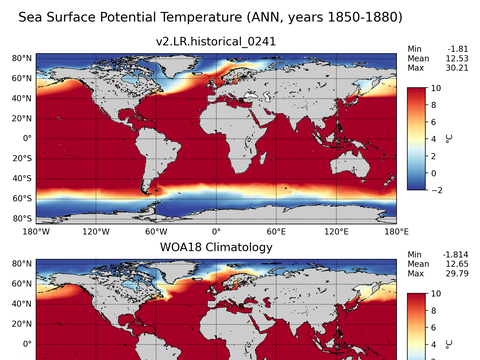
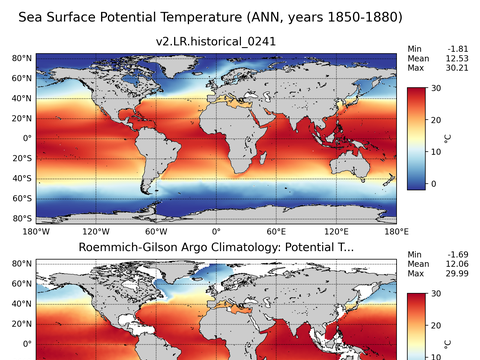
Global Sea Surface Temperature
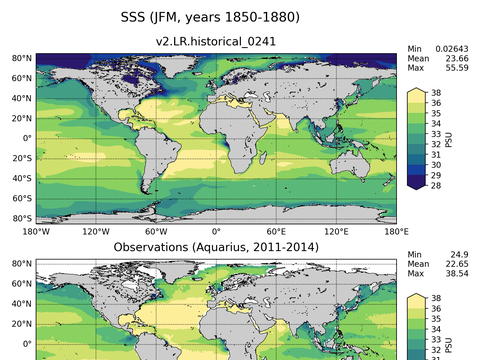
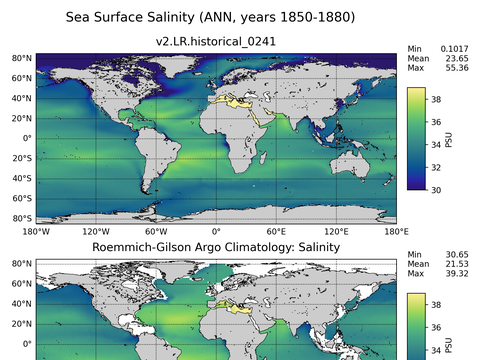
Global Sea Surface Salinity
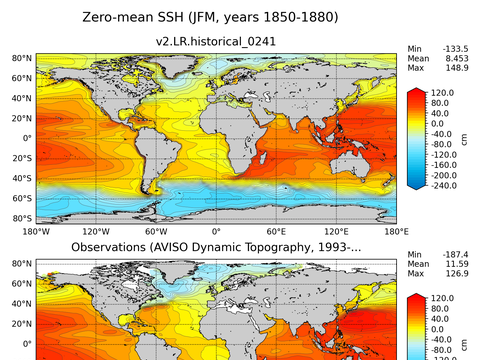
Global Sea Surface Height
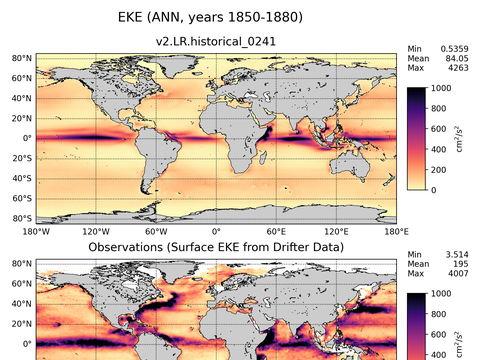
Global Eddy Kinetic Energy
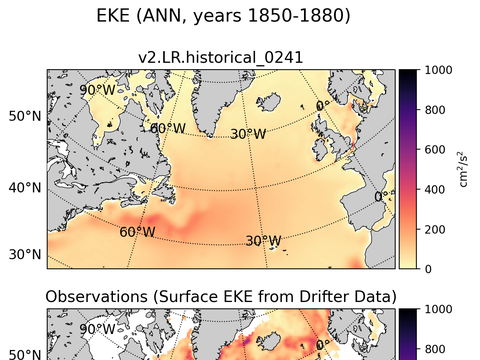
Subpolar North Atlantic Eddy Kinetic Energy

Global Horizontal Streamfunction

Subpolar North Atlantic Horizontal Streamfunction
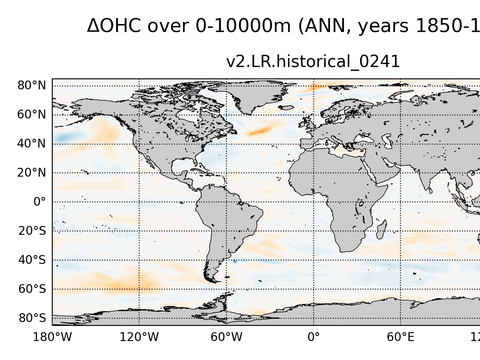
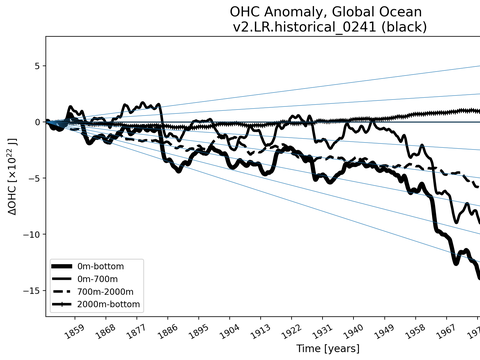
Global OHC Anomaly
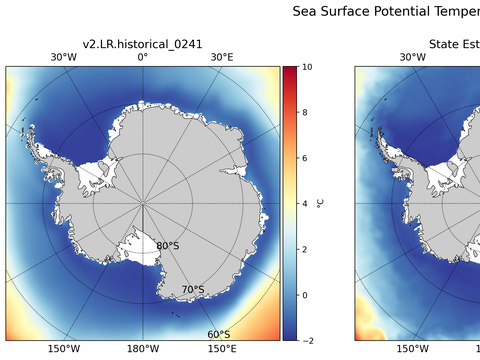
Antarctic Potential Temperature
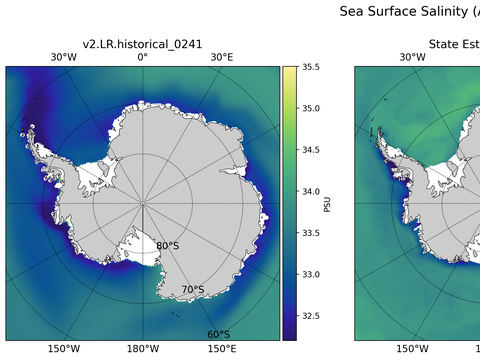
Antarctic Salinity
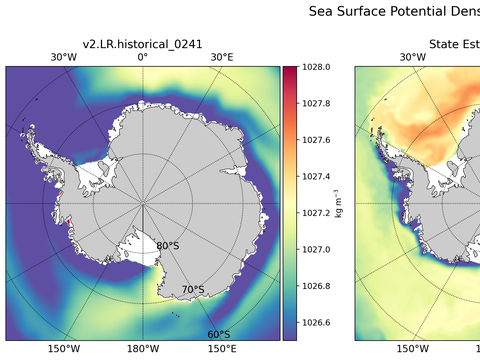
Antarctic Potential Density
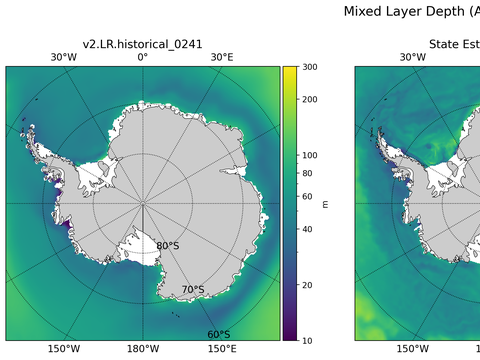
Antarctic Mixed Layer Depth
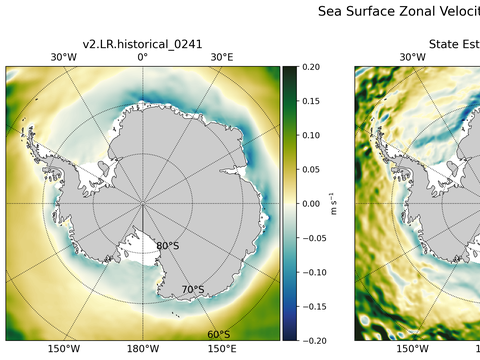
Antarctic Zonal Velocity
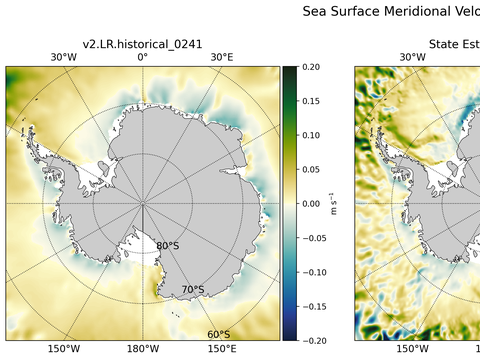
Antarctic Meridional Velocity
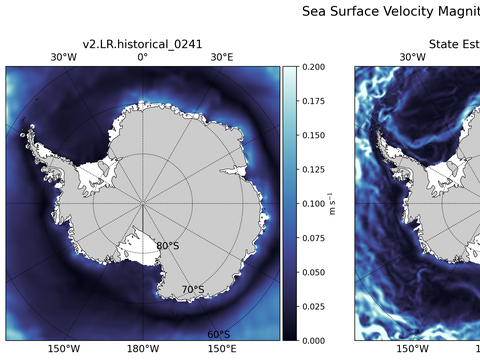
Antarctic Velocity Magnitude
Global Potential Temperature

Global Salinity
Global Argo Potential Temperature
Global Argo Salinity
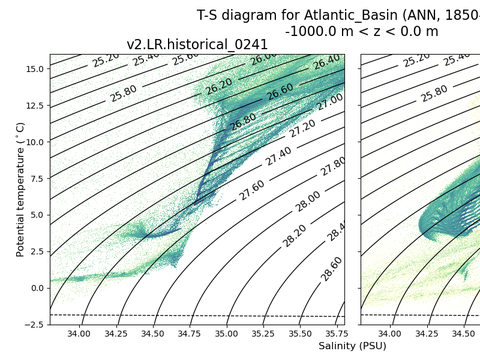
T-S Diagrams
Trends vs Depth
Time Series
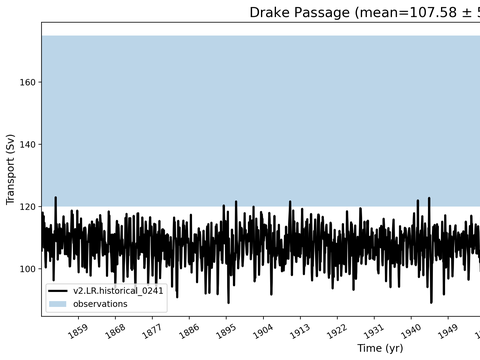
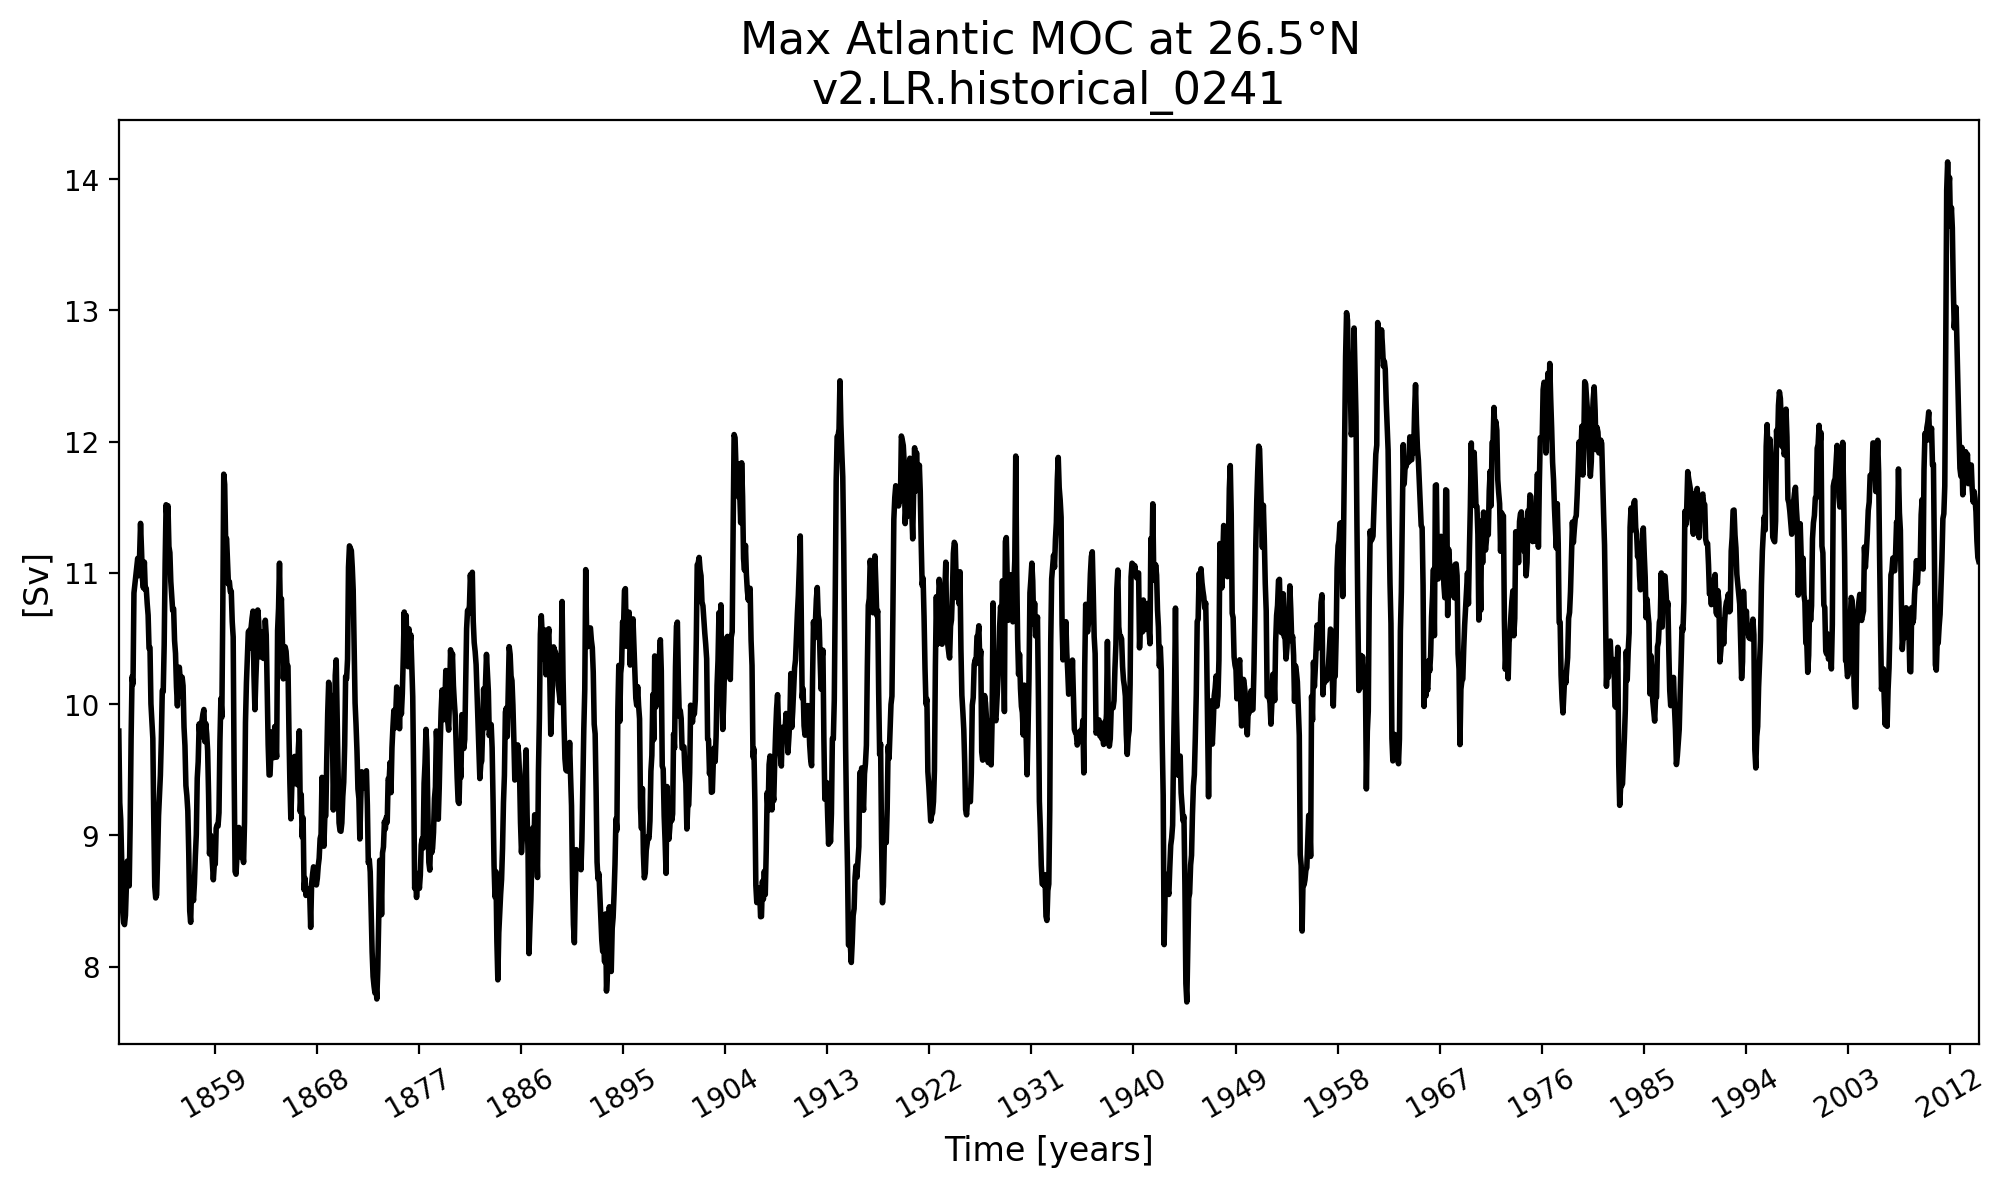
Transport Time Series
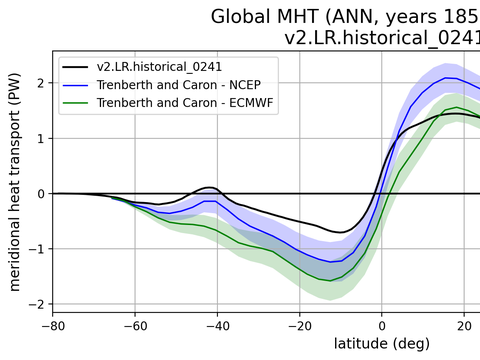
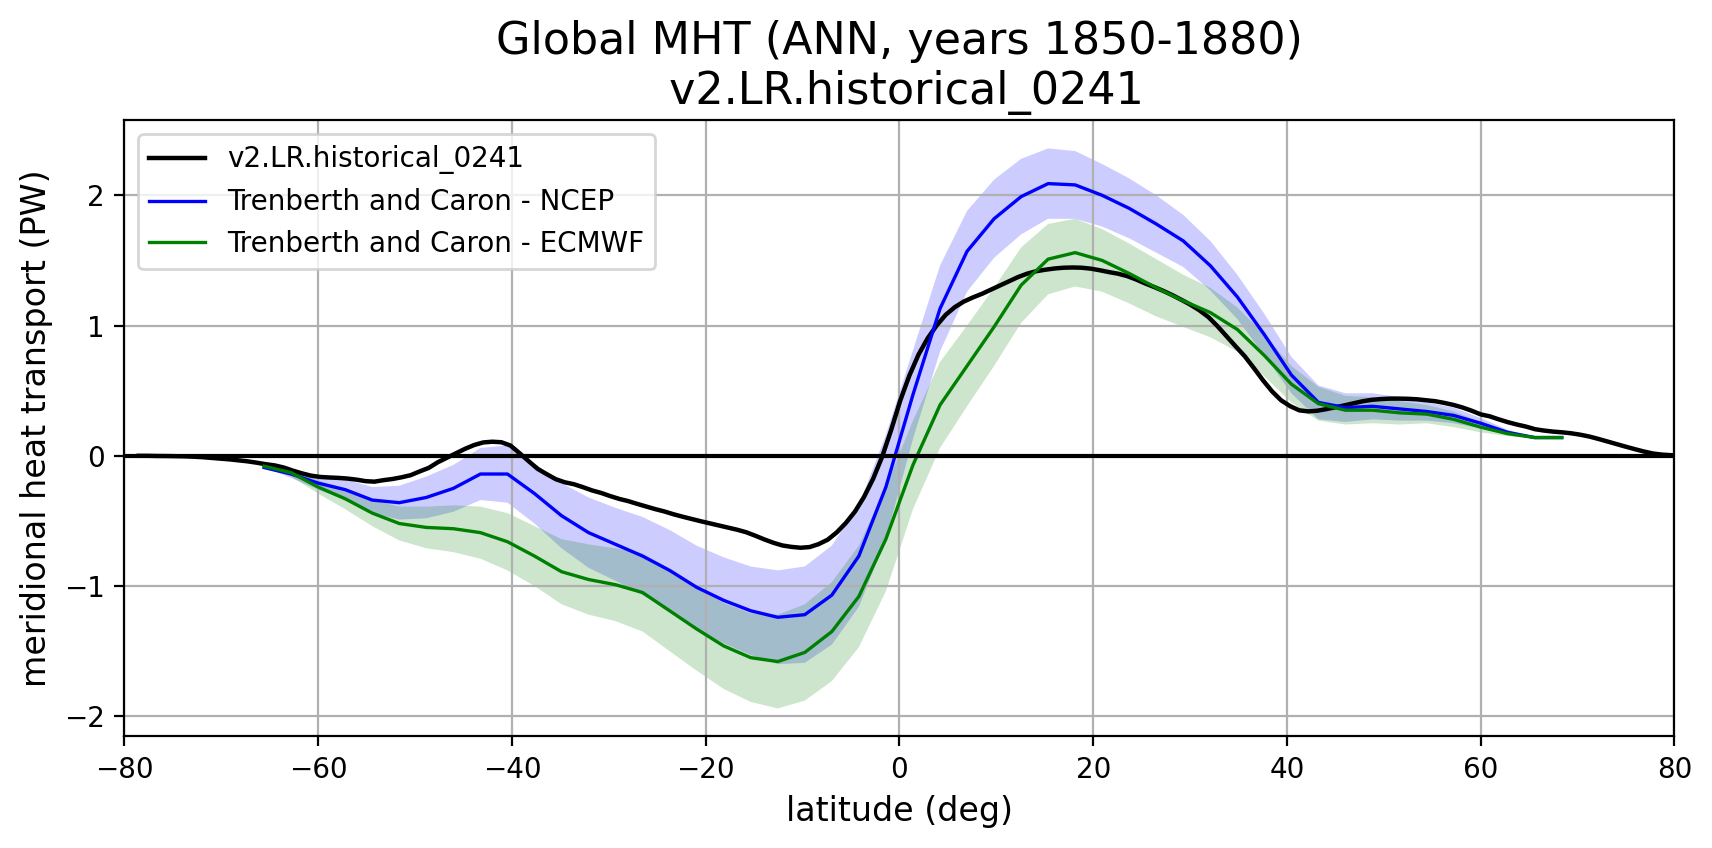
Meridional Heat Transport
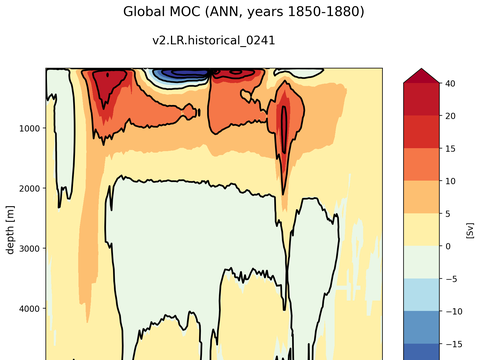
Meridional Overturning Streamfunction
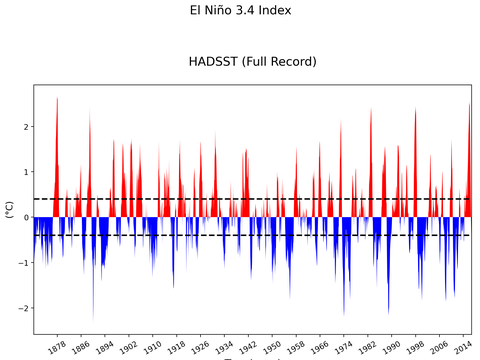
El Niño 3.4 Climate Index
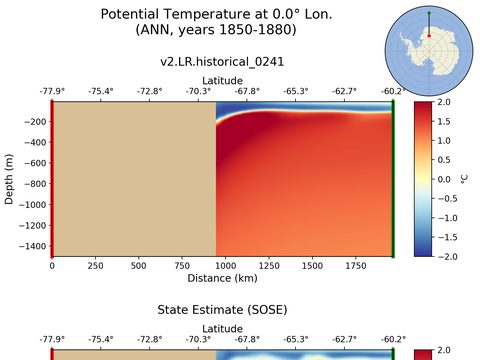
SOSE Transects
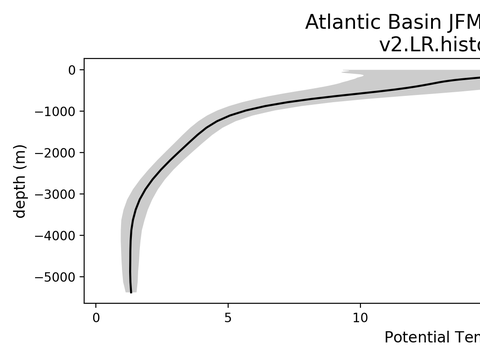
Ocean Basin Profiles
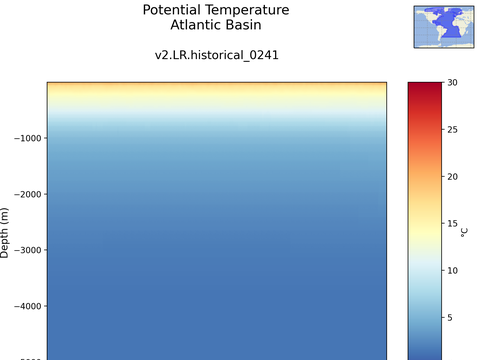
Ocean Basins Time Series vs Depths
Observations: Holte-Talley ARGO

JFM

JAS

ANN
Density MLD

JFM

JAS

ANN
Temperature MLD

JFM

JAS

ANN
Boundary-Layer Depth

JFM

JAS

ANN
Observations: Hadley-NOAA-OI

JFM

JAS

ANN
Observations: Aquarius

JFM

JAS

ANN
Observations: AVISO

JFM

JAS

ANN
Observations: EKE from Drifters

ANN
Observations: EKE from Drifters

ANN

ANN

ANN

ANN

ANN

ANN

ANN

ANN

ANN
State Estimate: SOSE

ANN surface

JFM surface

JAS surface

ANN z=-200 m

JFM z=-200 m

JAS z=-200 m

ANN z=-400 m

JFM z=-400 m

JAS z=-400 m

ANN z=-600 m

JFM z=-600 m

JAS z=-600 m

ANN z=-800 m

JFM z=-800 m

JAS z=-800 m

ANN floor

JFM floor

JAS floor
State Estimate: SOSE

ANN surface

JFM surface

JAS surface

ANN z=-200 m

JFM z=-200 m

JAS z=-200 m

ANN z=-400 m

JFM z=-400 m

JAS z=-400 m

ANN z=-600 m

JFM z=-600 m

JAS z=-600 m

ANN z=-800 m

JFM z=-800 m

JAS z=-800 m

ANN floor

JFM floor

JAS floor
State Estimate: SOSE

ANN surface

JFM surface

JAS surface

ANN z=-200 m

JFM z=-200 m

JAS z=-200 m

ANN z=-400 m

JFM z=-400 m

JAS z=-400 m

ANN z=-600 m

JFM z=-600 m

JAS z=-600 m

ANN z=-800 m

JFM z=-800 m

JAS z=-800 m

ANN floor

JFM floor

JAS floor
State Estimate: SOSE

ANN

JFM

JAS
State Estimate: SOSE

ANN surface

JFM surface

JAS surface

ANN z=-200 m

JFM z=-200 m

JAS z=-200 m

ANN z=-400 m

JFM z=-400 m

JAS z=-400 m

ANN z=-600 m

JFM z=-600 m

JAS z=-600 m

ANN z=-800 m

JFM z=-800 m

JAS z=-800 m

ANN floor

JFM floor

JAS floor
State Estimate: SOSE

ANN surface

JFM surface

JAS surface

ANN z=-200 m

JFM z=-200 m

JAS z=-200 m

ANN z=-400 m

JFM z=-400 m

JAS z=-400 m

ANN z=-600 m

JFM z=-600 m

JAS z=-600 m

ANN z=-800 m

JFM z=-800 m

JAS z=-800 m

ANN floor

JFM floor

JAS floor
State Estimate: SOSE

ANN surface

JFM surface

JAS surface

ANN z=-200 m

JFM z=-200 m

JAS z=-200 m

ANN z=-400 m

JFM z=-400 m

JAS z=-400 m

ANN z=-600 m

JFM z=-600 m

JAS z=-600 m

ANN z=-800 m

JFM z=-800 m

JAS z=-800 m

ANN floor

JFM floor

JAS floor
WOA18 Climatology

ANN surface

JFM surface

JAS surface

ANN z=-500 m

JFM z=-500 m

JAS z=-500 m

ANN z=-1000 m

JFM z=-1000 m

JAS z=-1000 m
WOA18 Climatology

ANN surface

JFM surface

JAS surface

ANN z=-500 m

JFM z=-500 m

JAS z=-500 m

ANN z=-1000 m

JFM z=-1000 m

JAS z=-1000 m
Roemmich-Gilson Climatology: Argo

ANN surface

ANN z=-25 m

ANN z=-50 m

ANN z=-100 m

ANN z=-150 m

ANN z=-200 m

ANN z=-400 m

ANN z=-800 m

ANN z=-1500 m

JAS surface

JAS z=-25 m

JAS z=-50 m

JAS z=-100 m

JAS z=-150 m

JAS z=-200 m

JAS z=-400 m

JAS z=-800 m

JAS z=-1500 m

JFM surface

JFM z=-25 m

JFM z=-50 m

JFM z=-100 m

JFM z=-150 m

JFM z=-200 m

JFM z=-400 m

JFM z=-800 m

JFM z=-1500 m
Roemmich-Gilson Climatology: Argo

ANN surface

ANN z=-25 m

ANN z=-50 m

ANN z=-100 m

ANN z=-150 m

ANN z=-200 m

ANN z=-400 m

ANN z=-600 m

ANN z=-800 m

ANN z=-1500 m

JFM surface

JFM z=-25 m

JFM z=-50 m

JFM z=-100 m

JFM z=-150 m

JFM z=-200 m

JFM z=-400 m

JFM z=-600 m

JFM z=-800 m

JFM z=-1500 m

JAS surface

JAS z=-25 m

JAS z=-50 m

JAS z=-100 m

JAS z=-150 m

JAS z=-200 m

JAS z=-400 m

JAS z=-600 m

JAS z=-800 m

JAS z=-1500 m
Ocean Basins

Atlantic_Basin

Pacific_Basin

Indian_Basin

Arctic_Basin

Southern_Ocean_Basin

Mediterranean_Basin
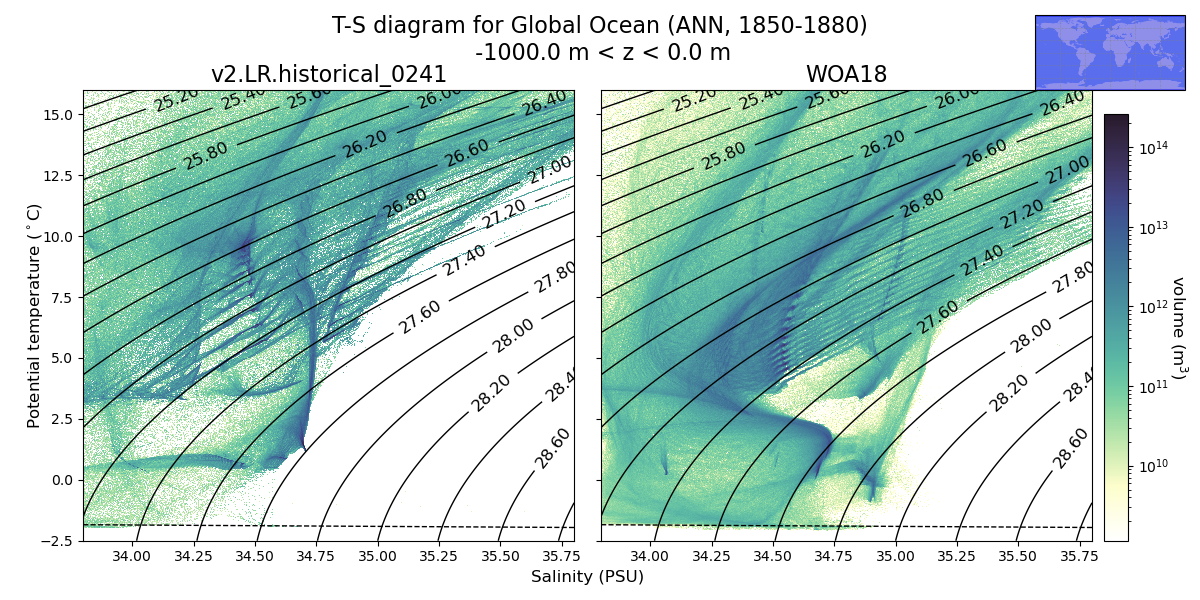
Global Ocean
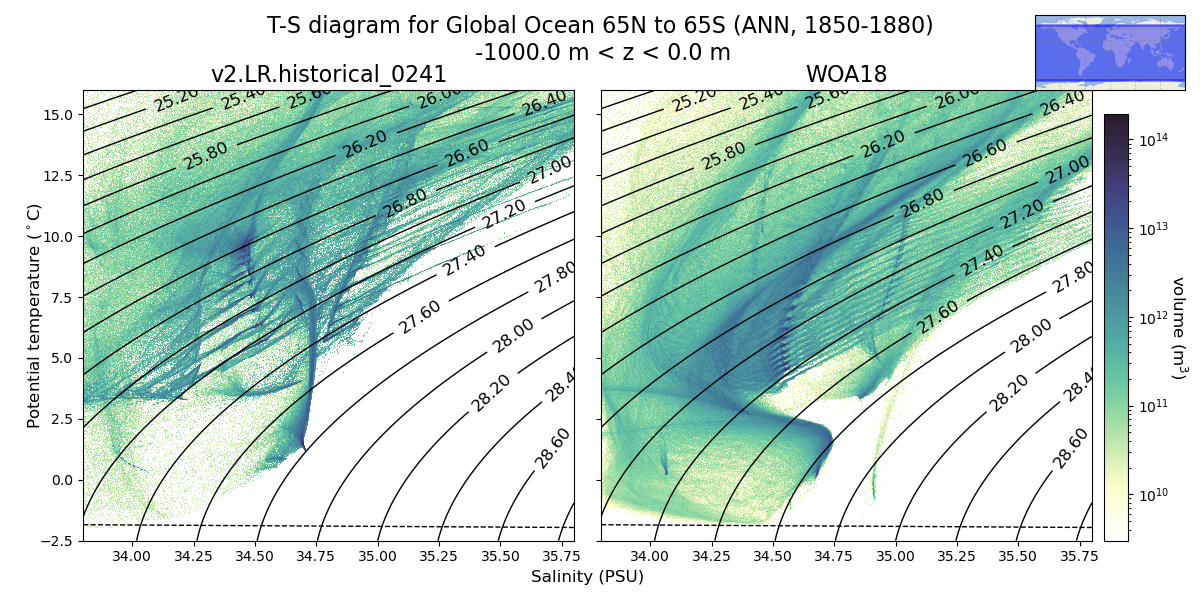
Global Ocean 65N to 65S
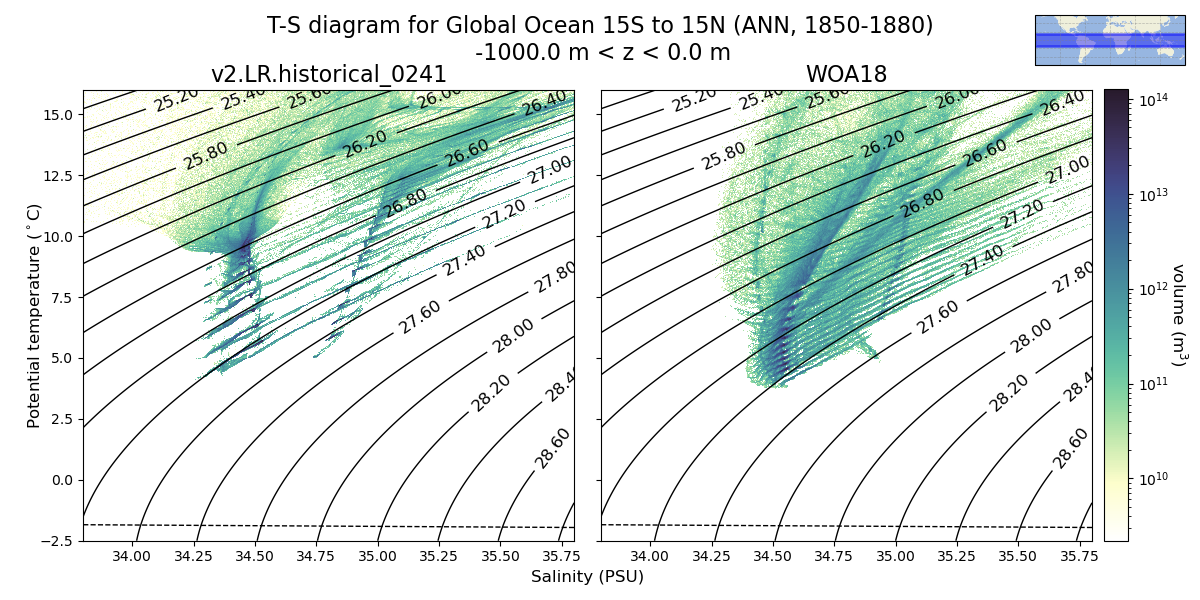
Global Ocean 15S to 15N
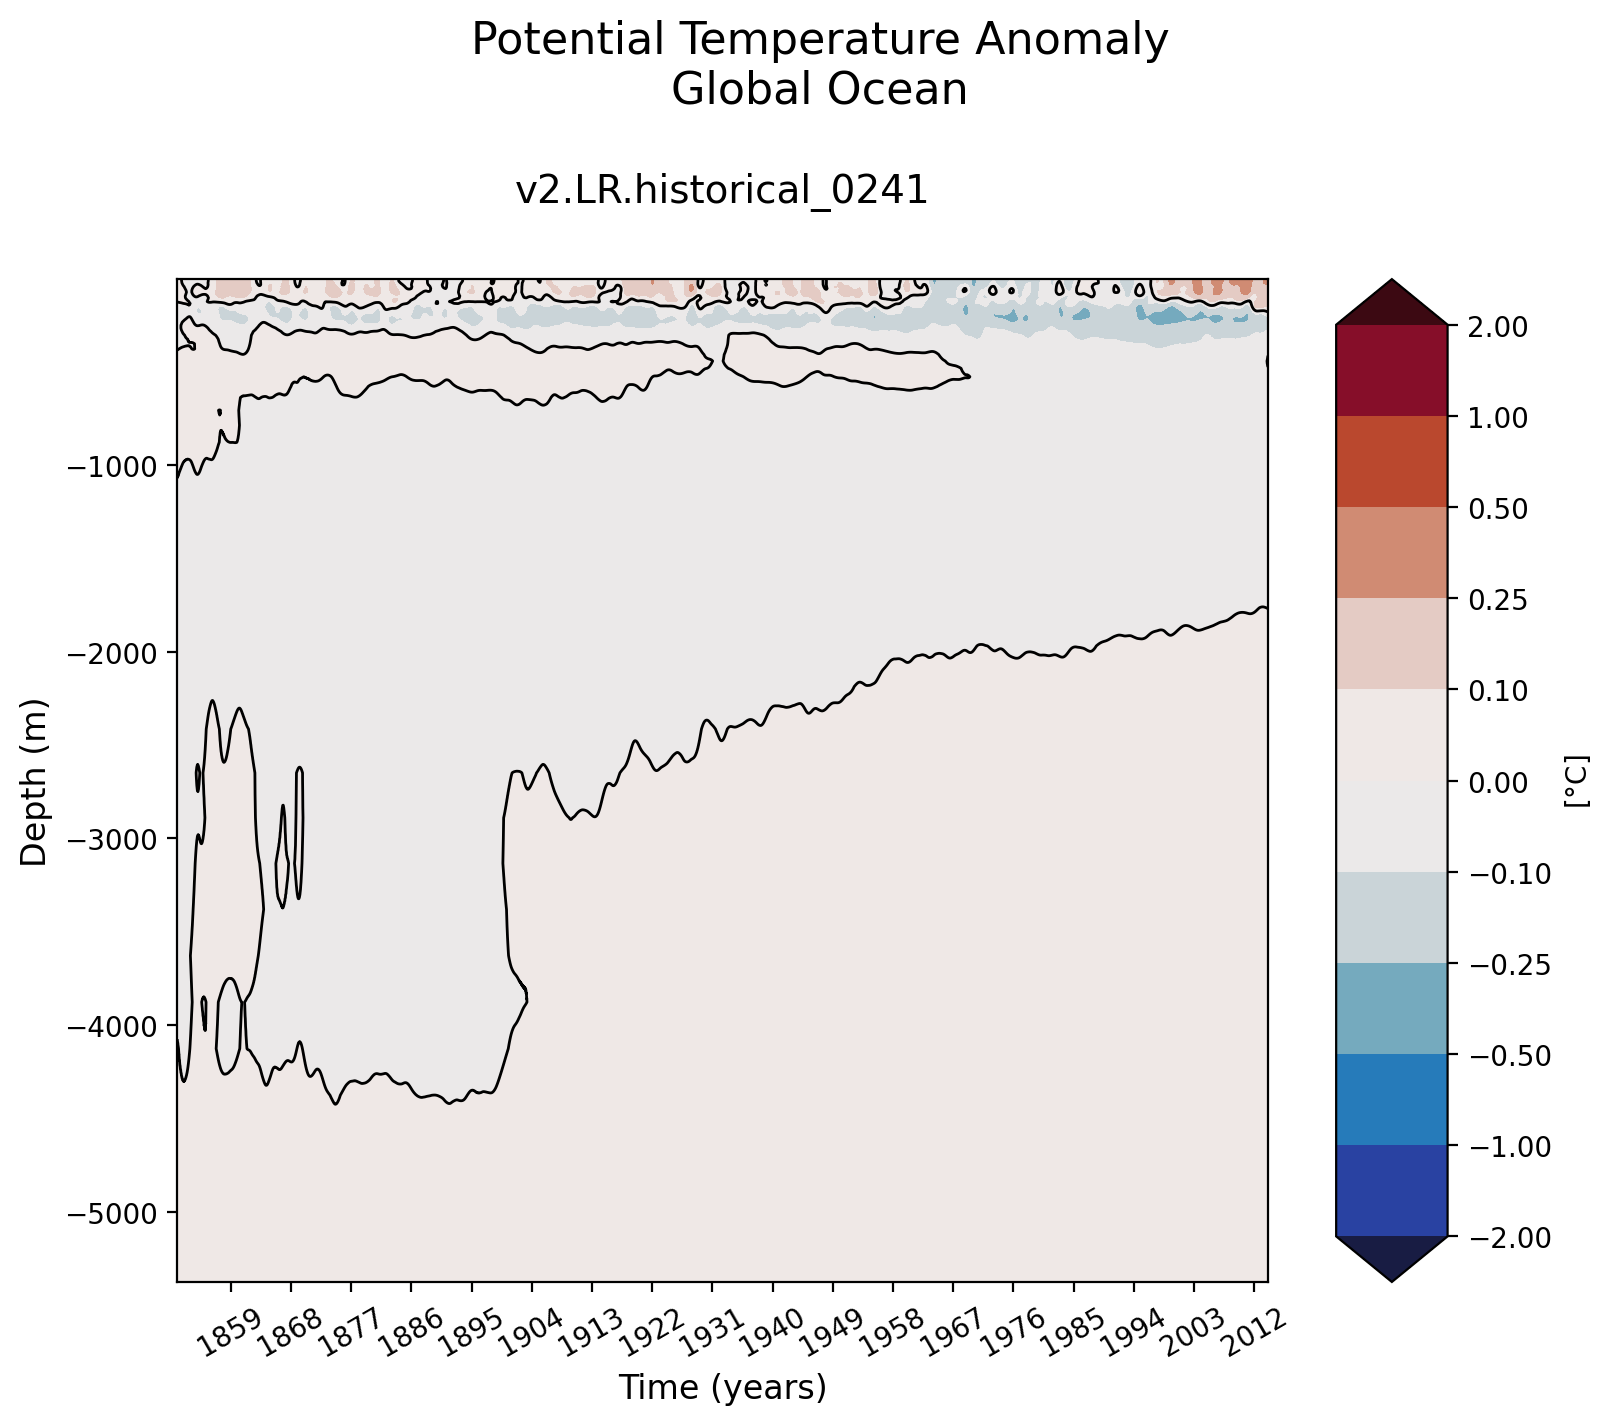
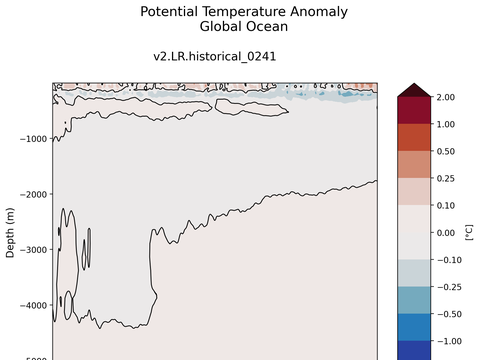
Global Ocean Δϴ
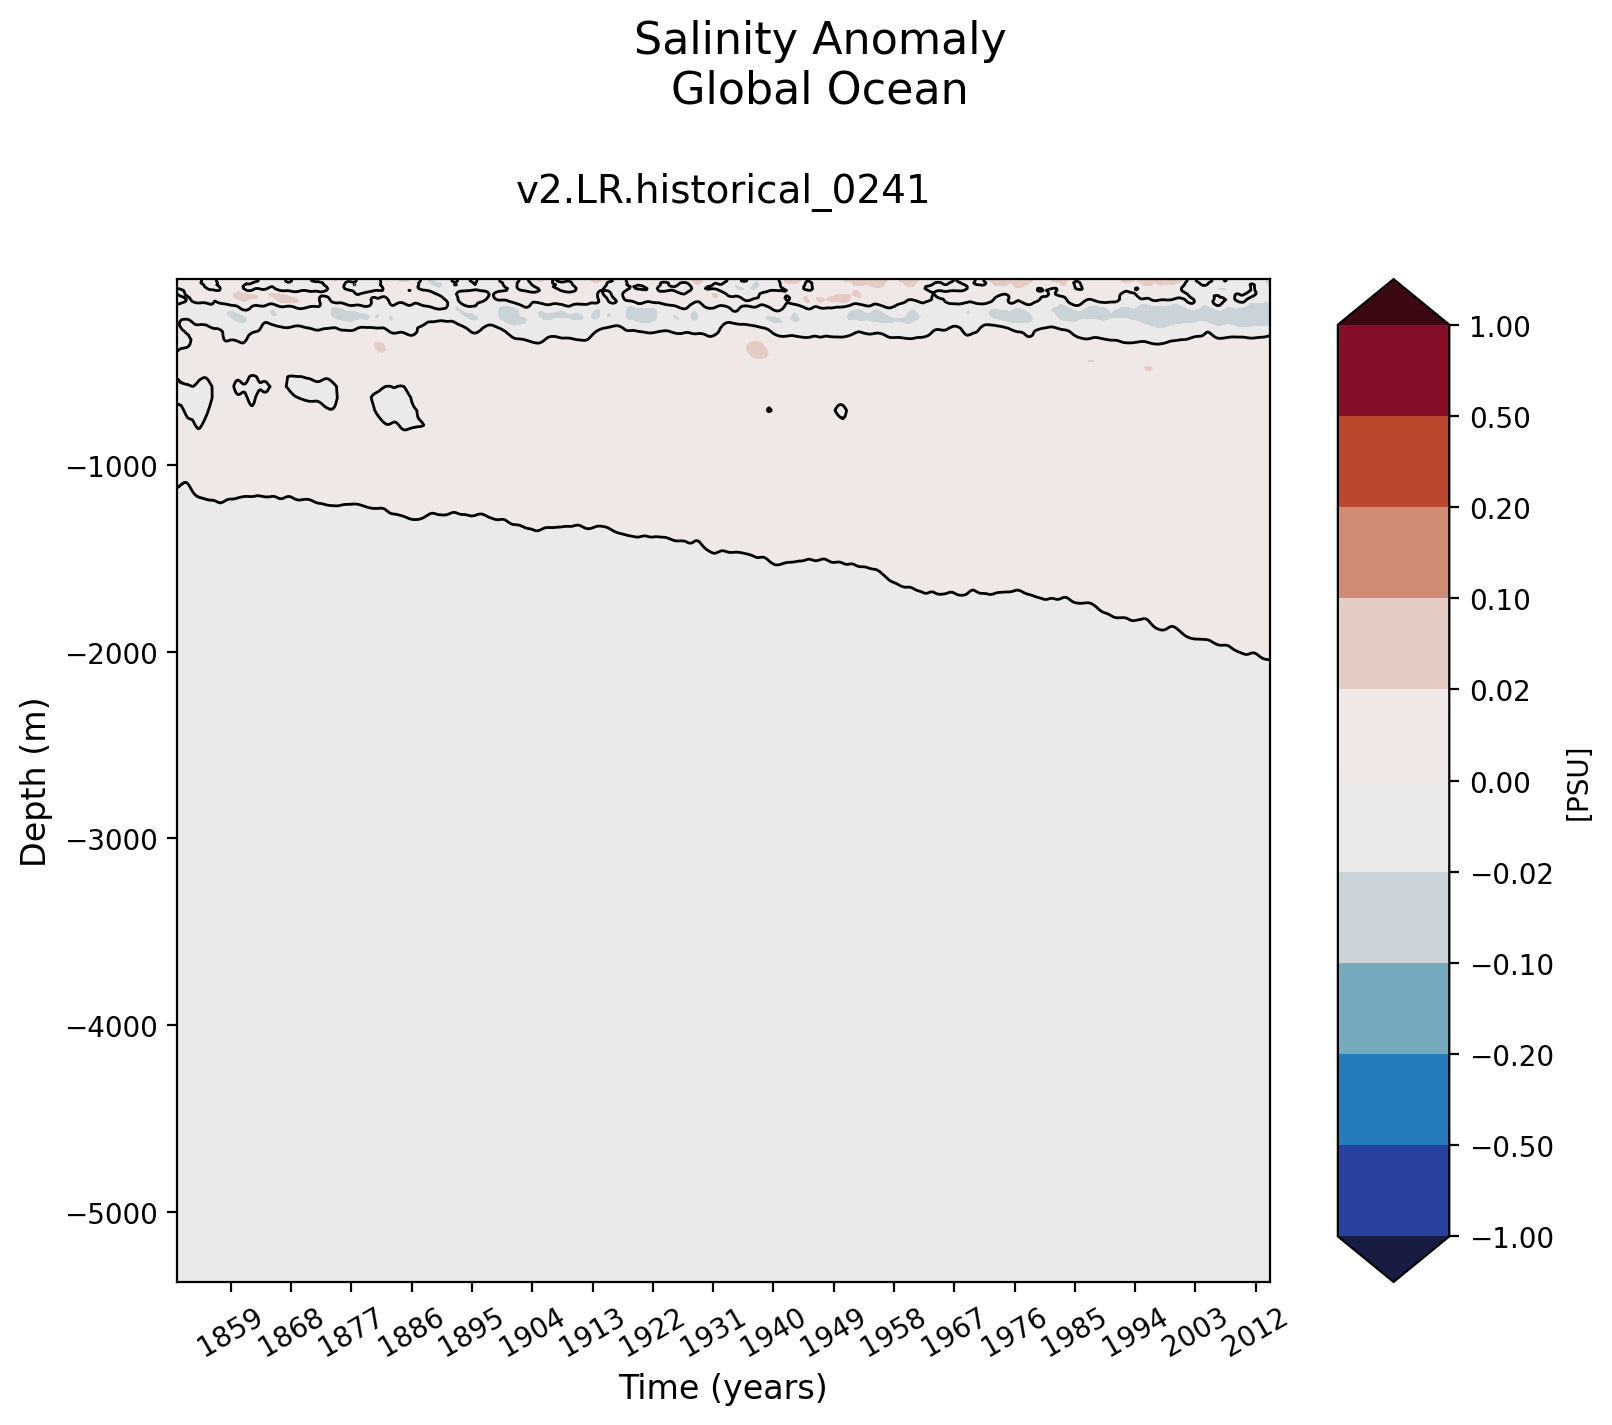
Global Ocean ΔS
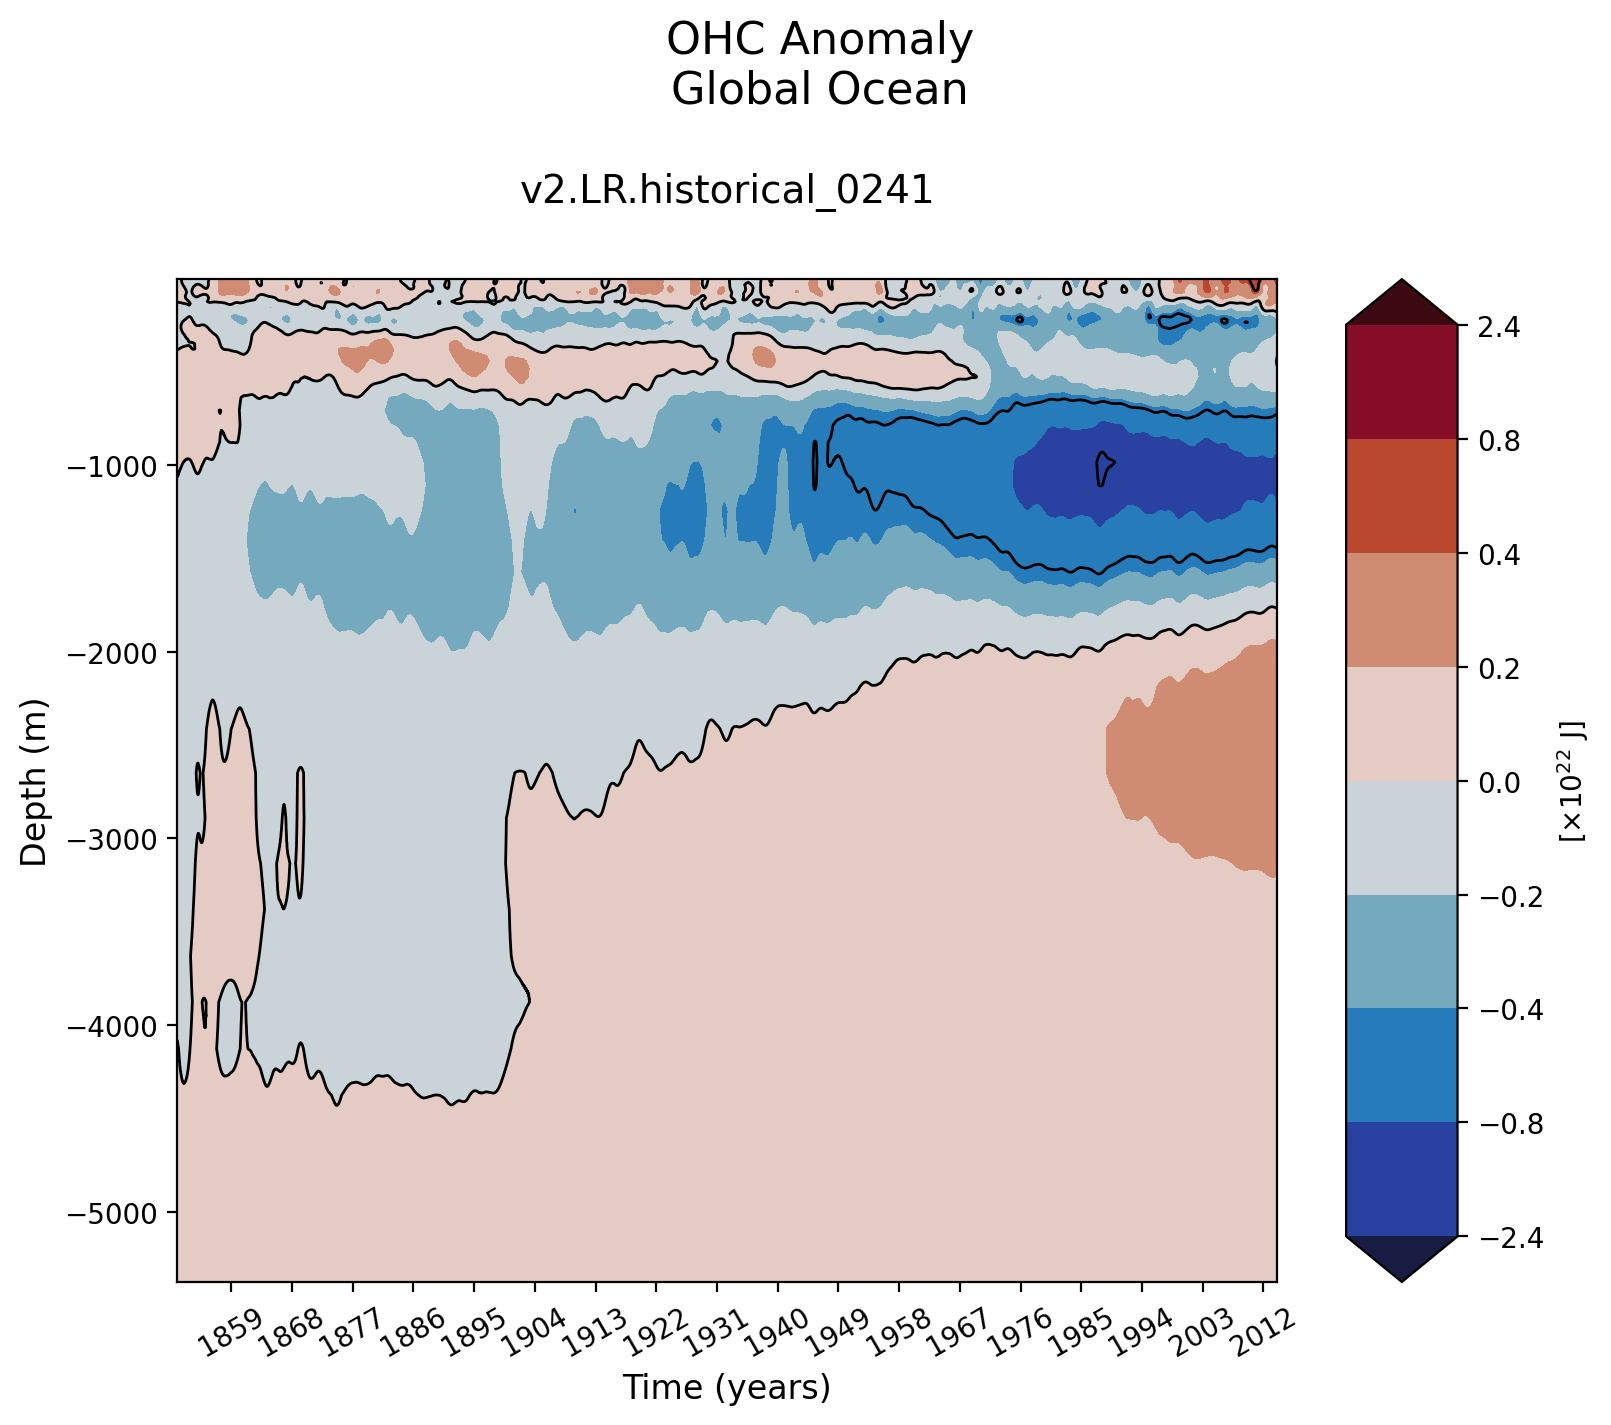
Global Ocean ΔOHC
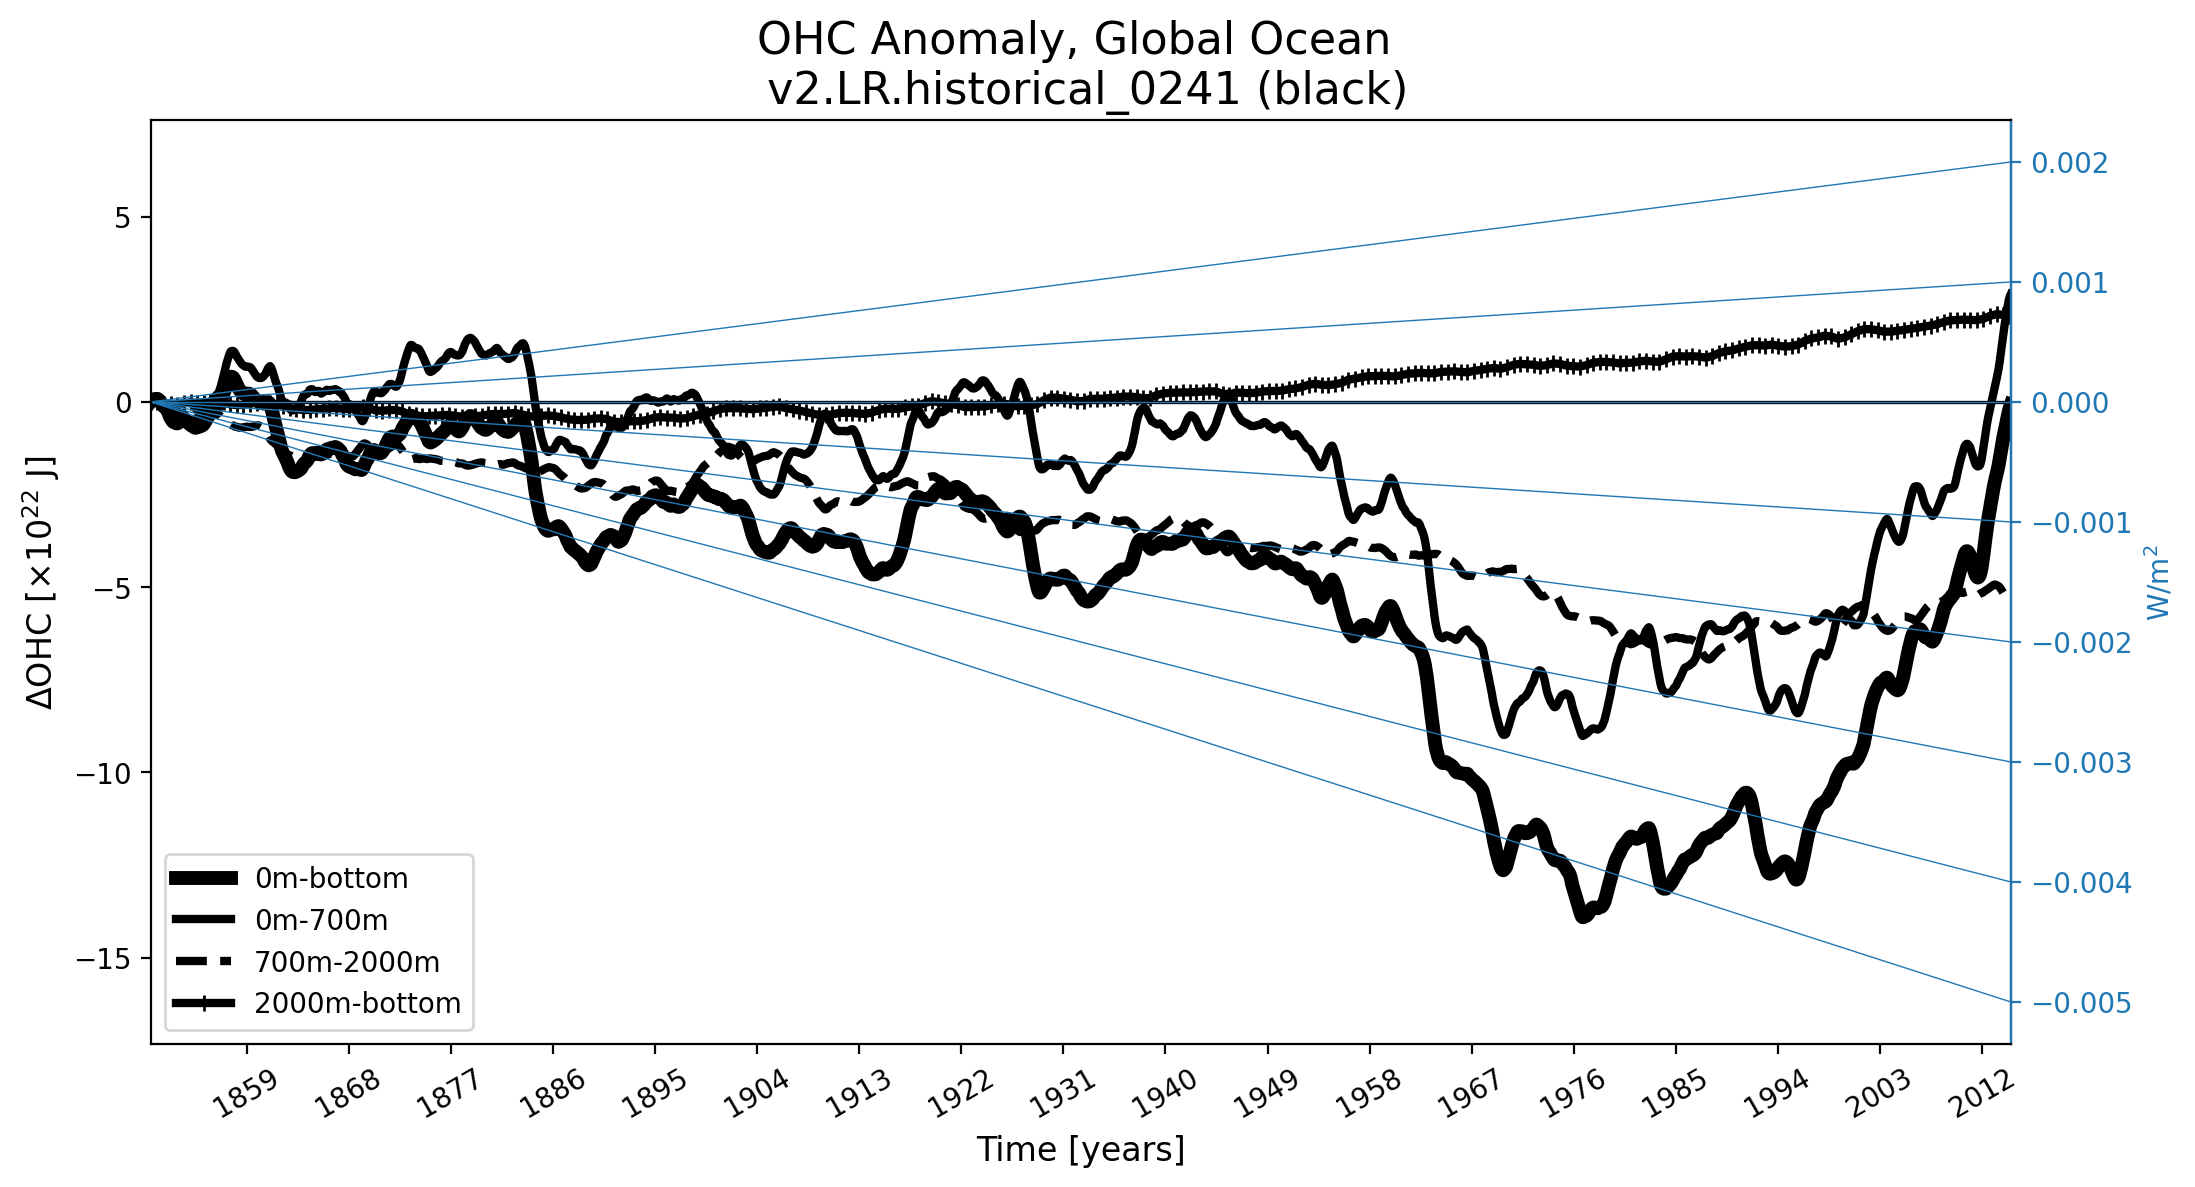
global ΔOHC

SSH Anomaly

global SST
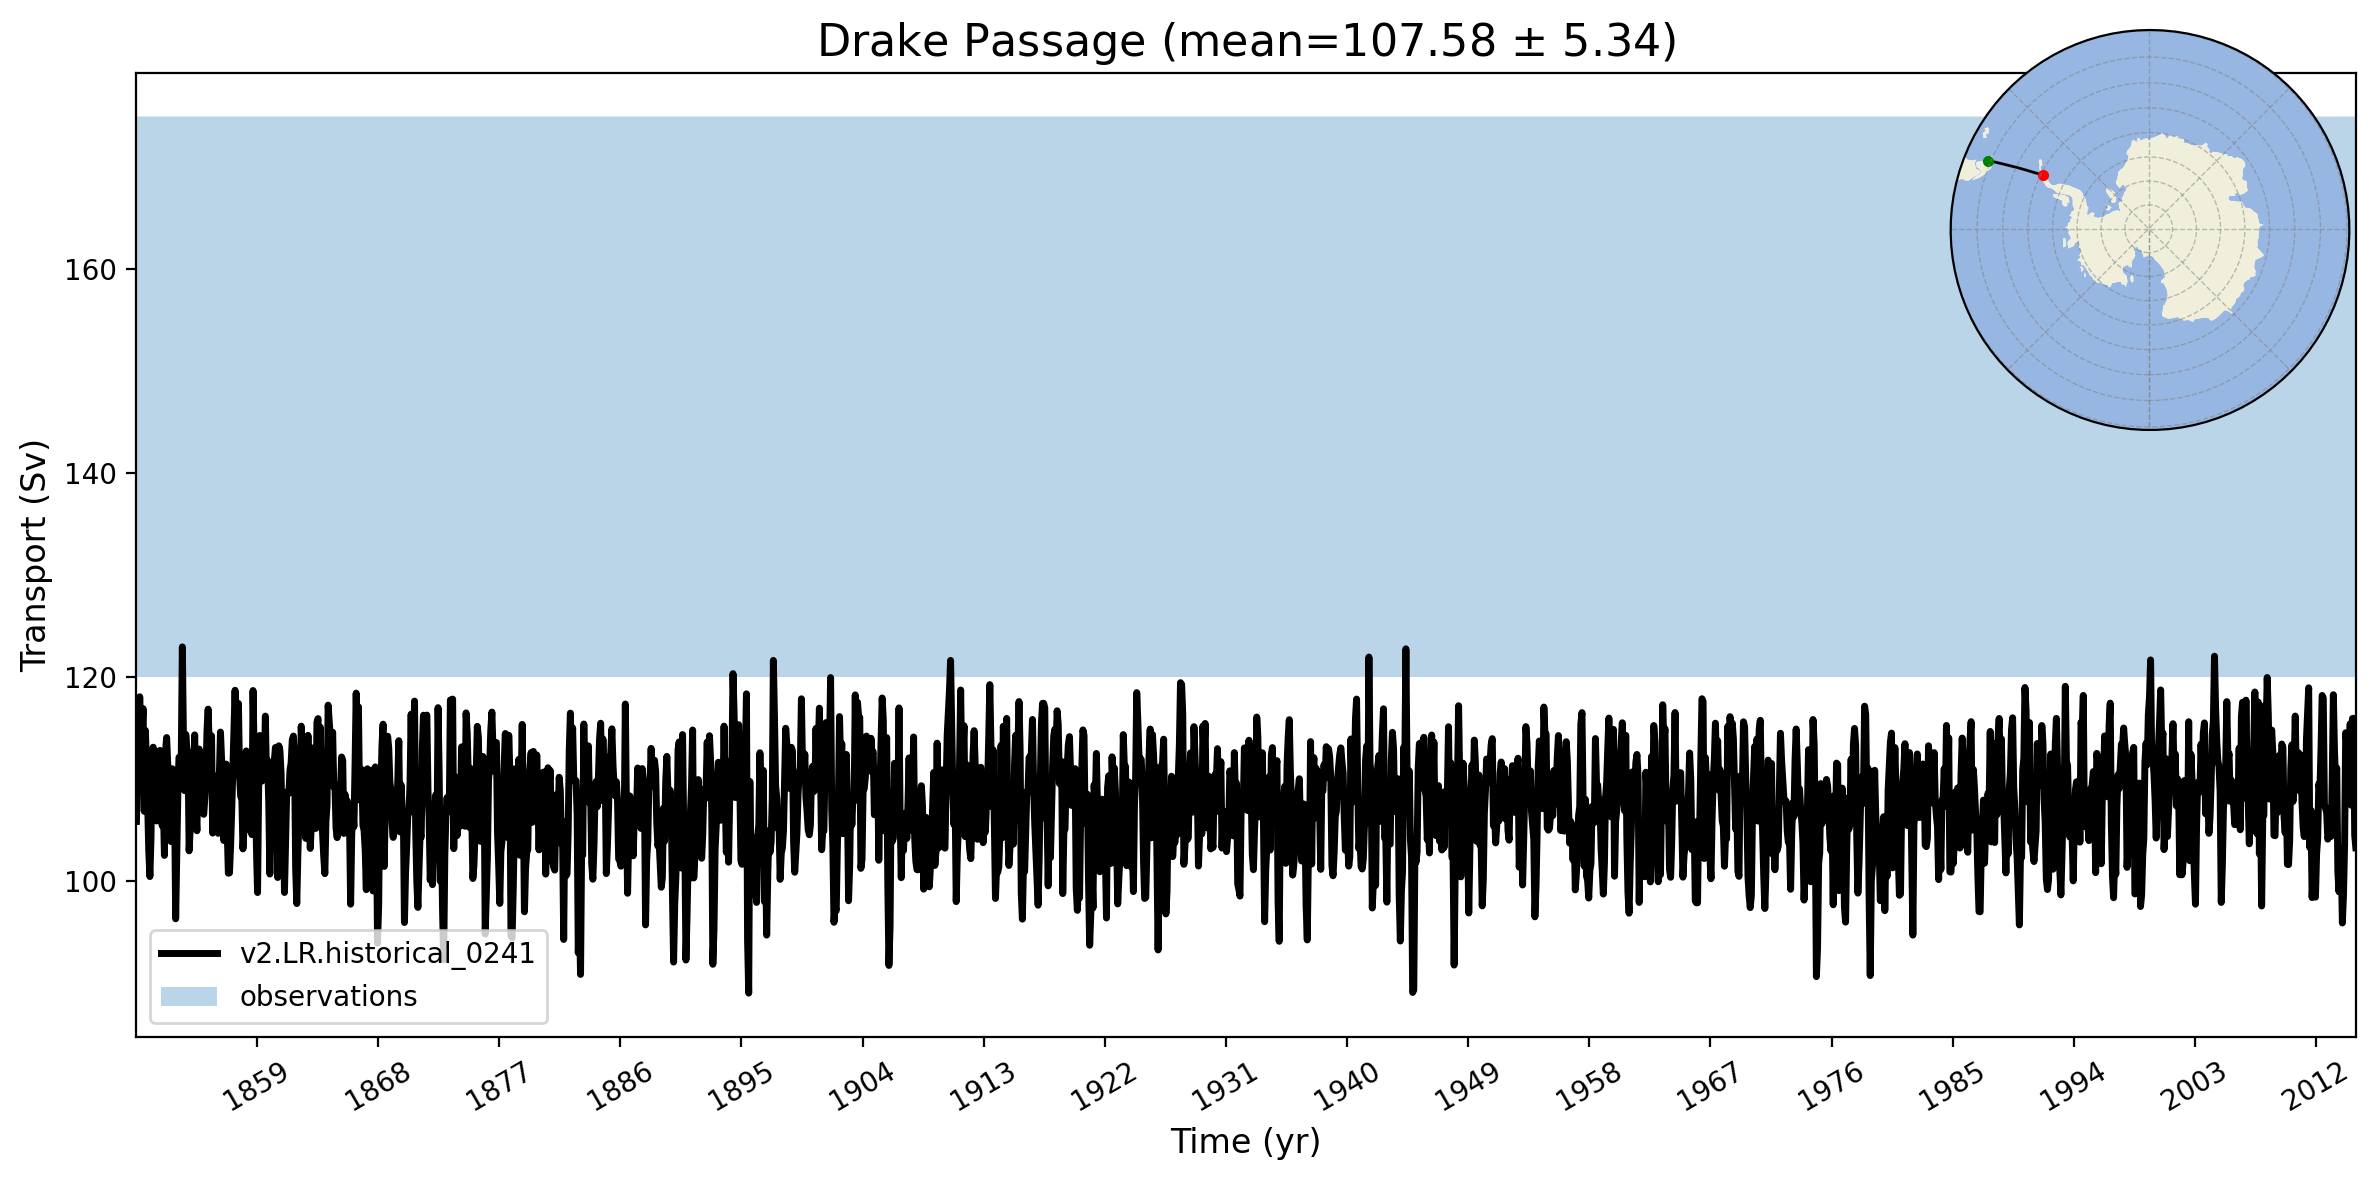
Drake Passage
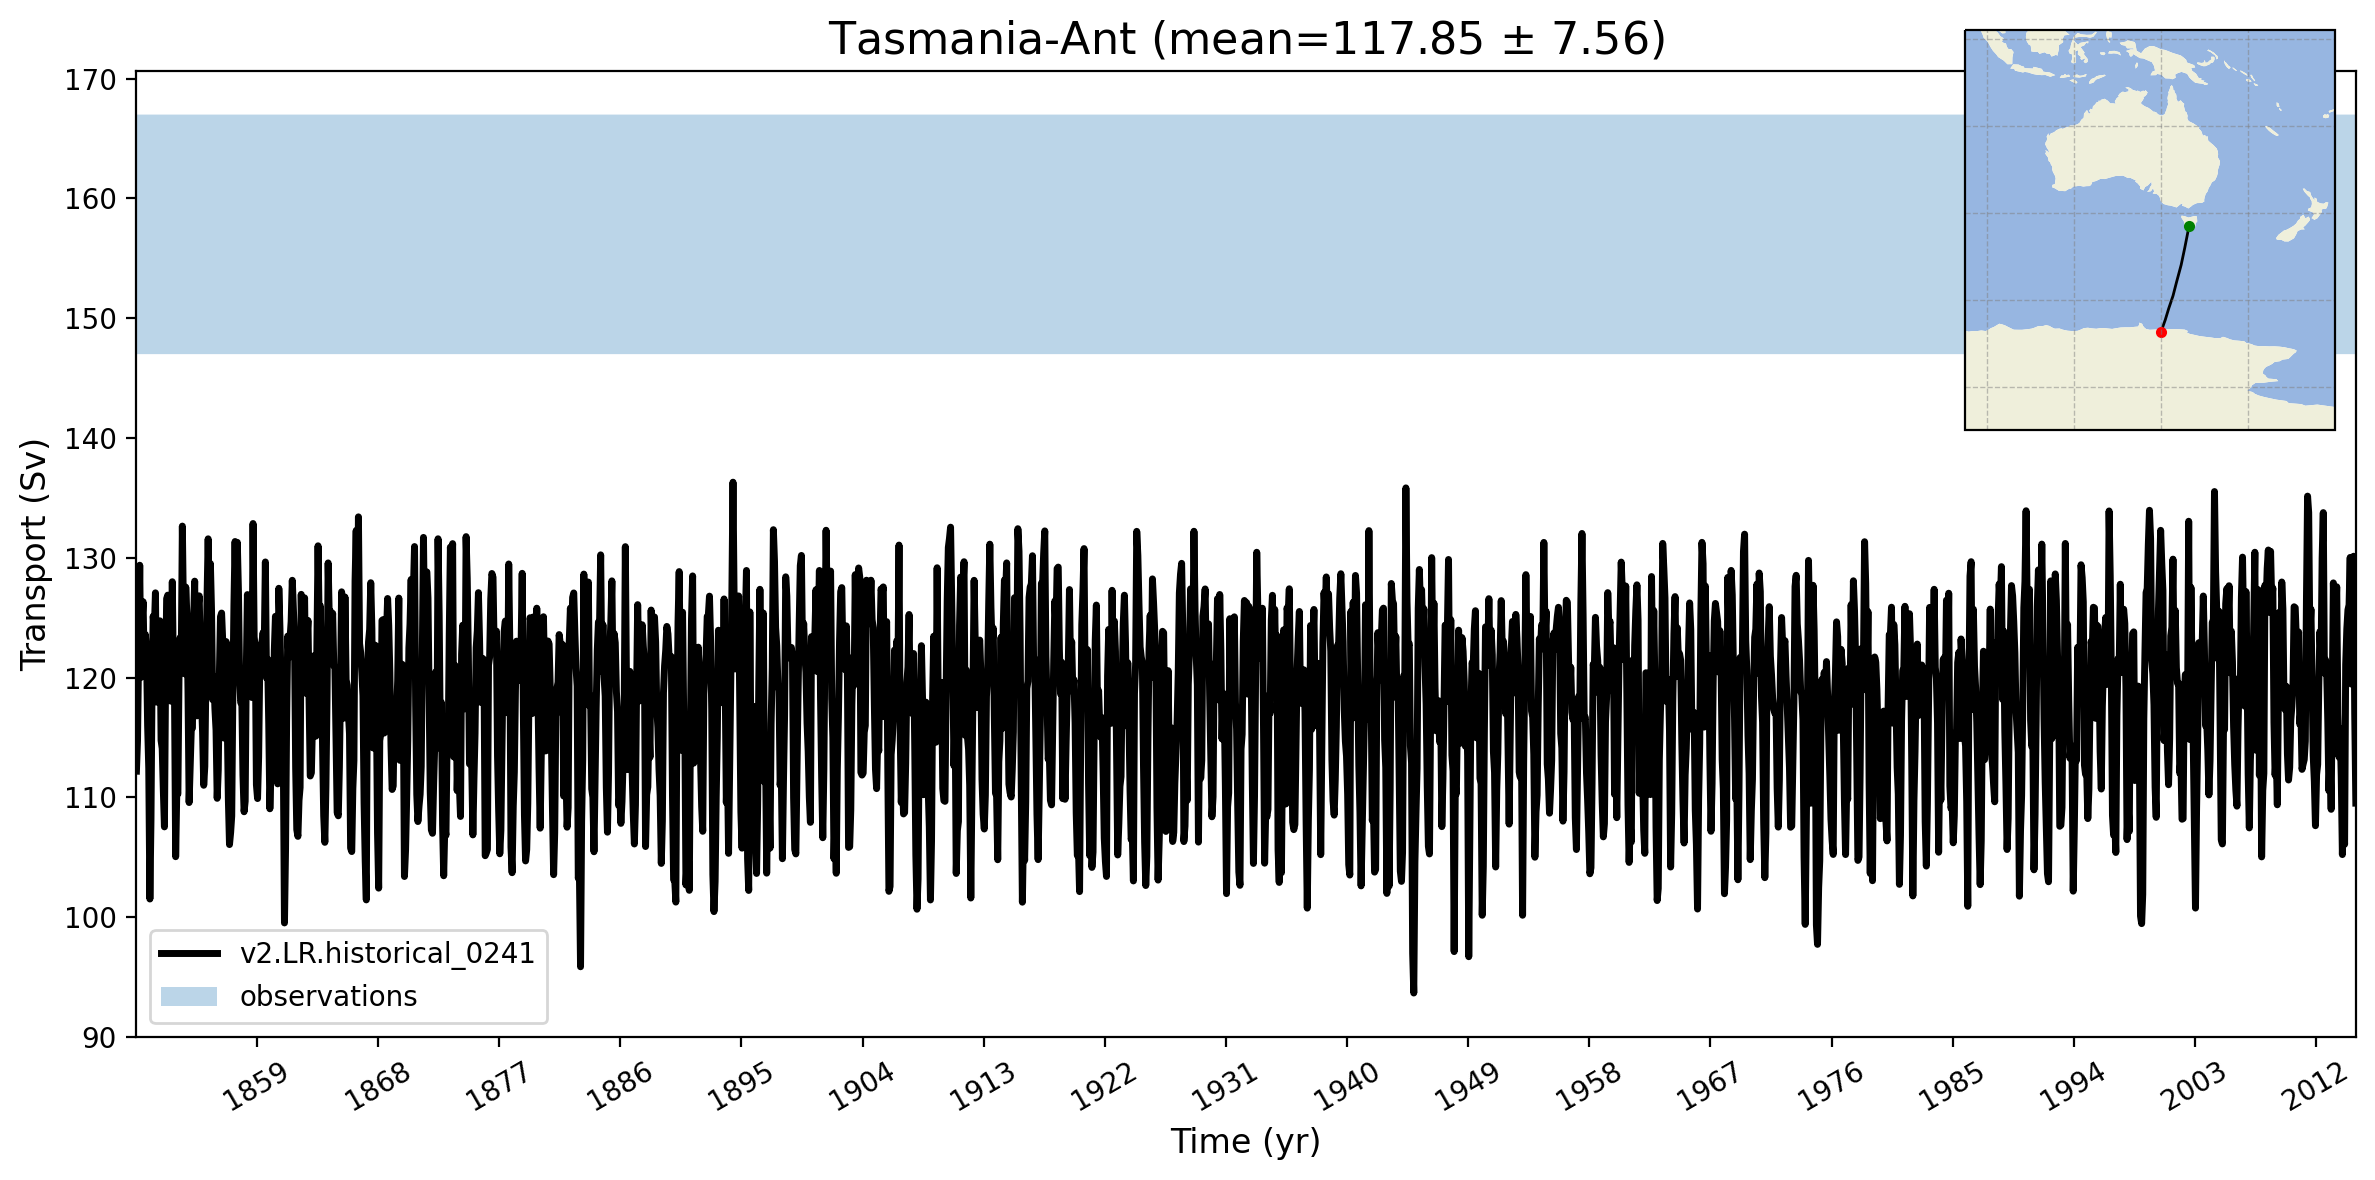
Tasmania-Ant
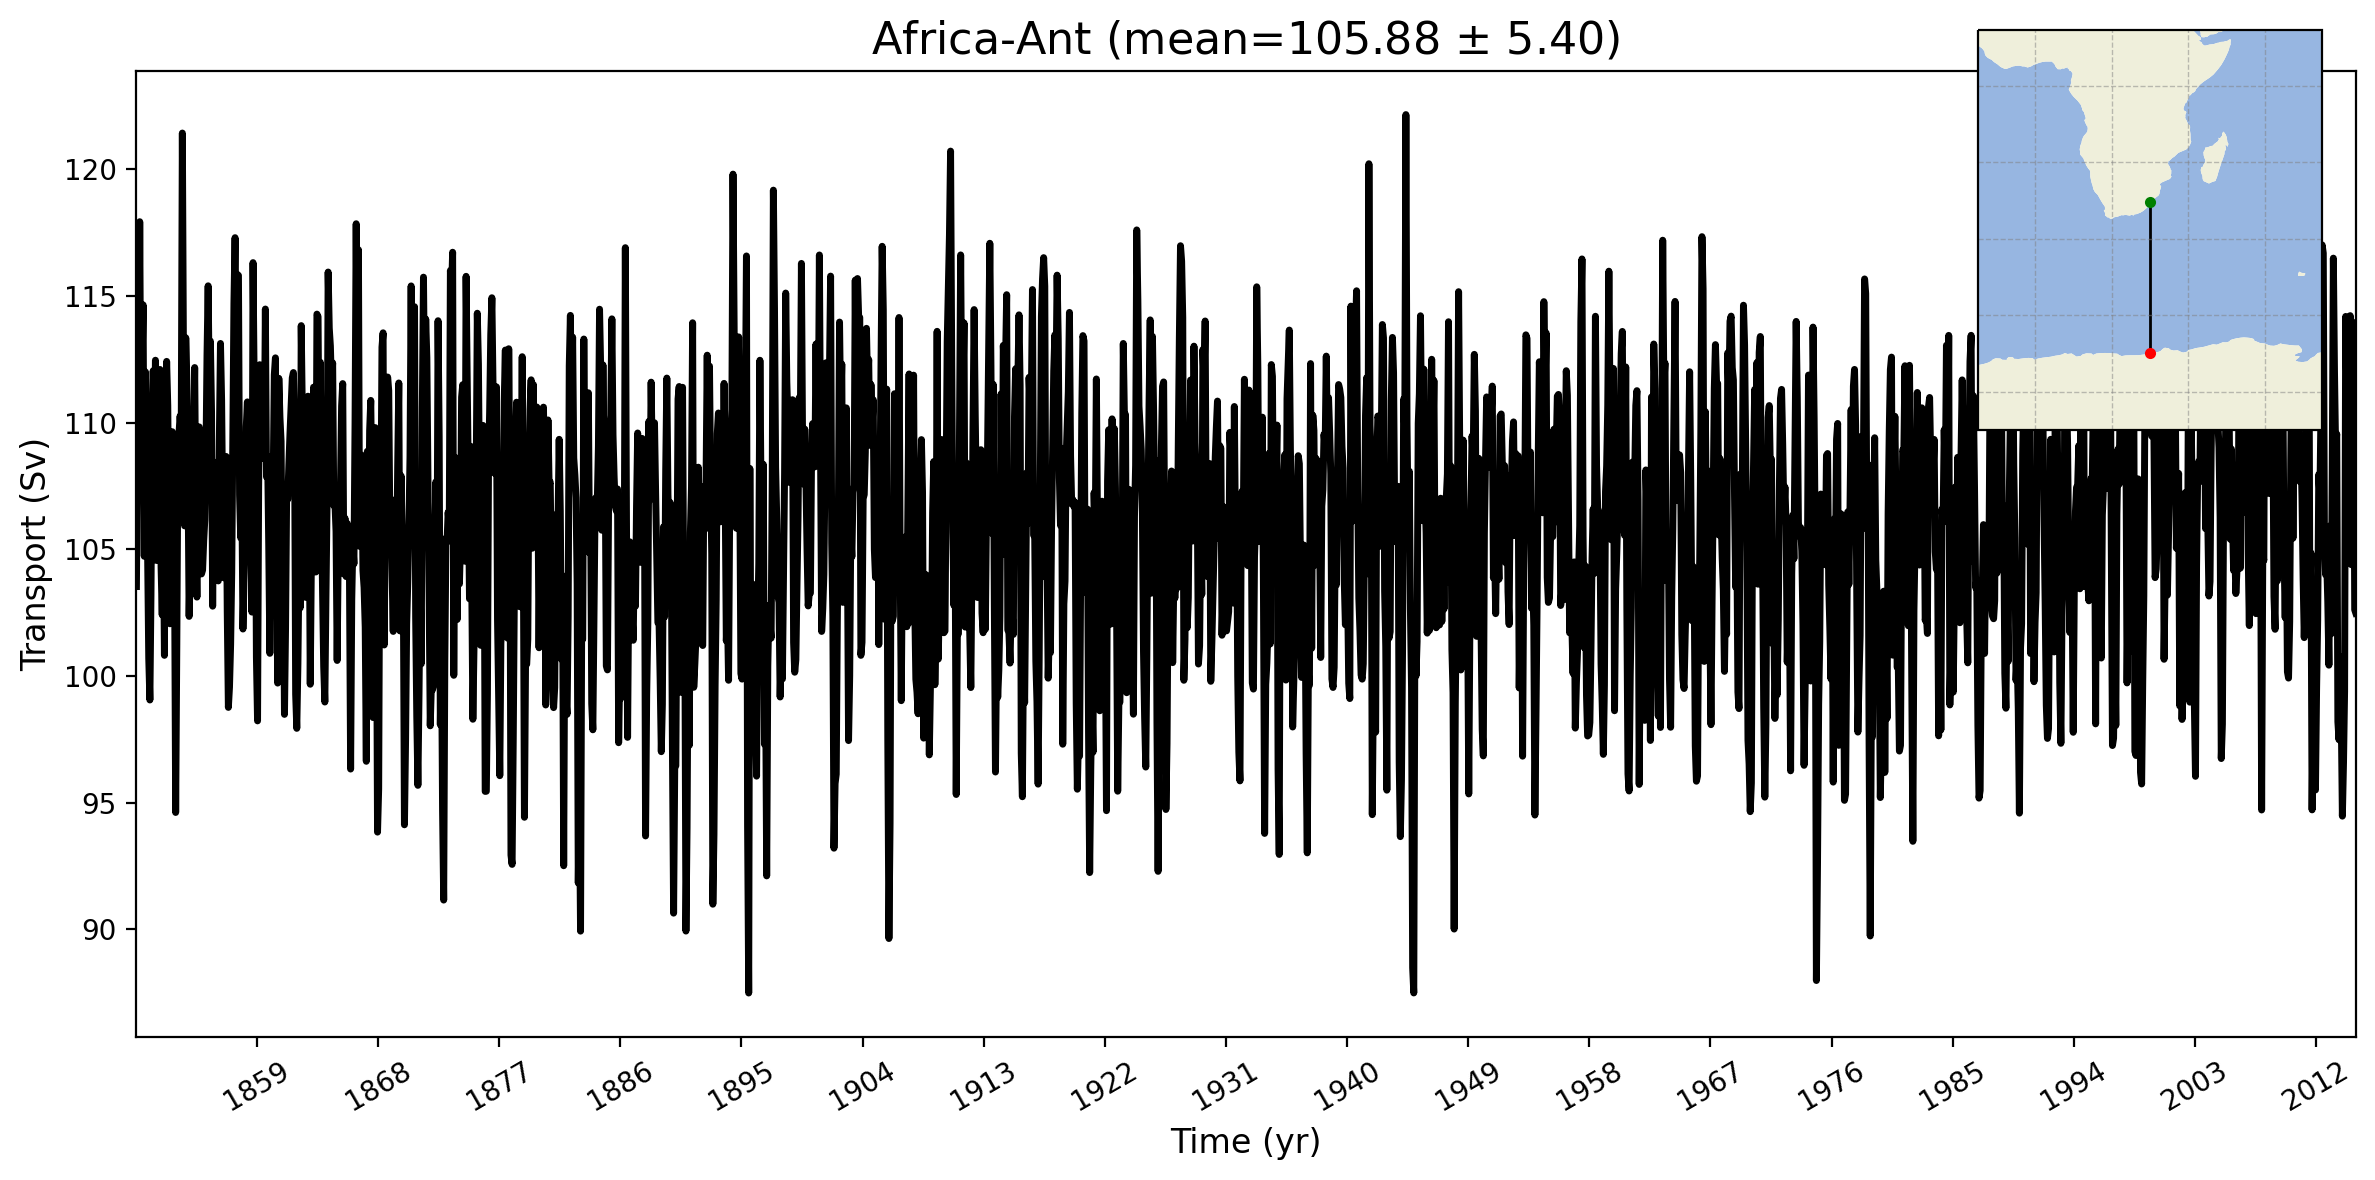
Africa-Ant
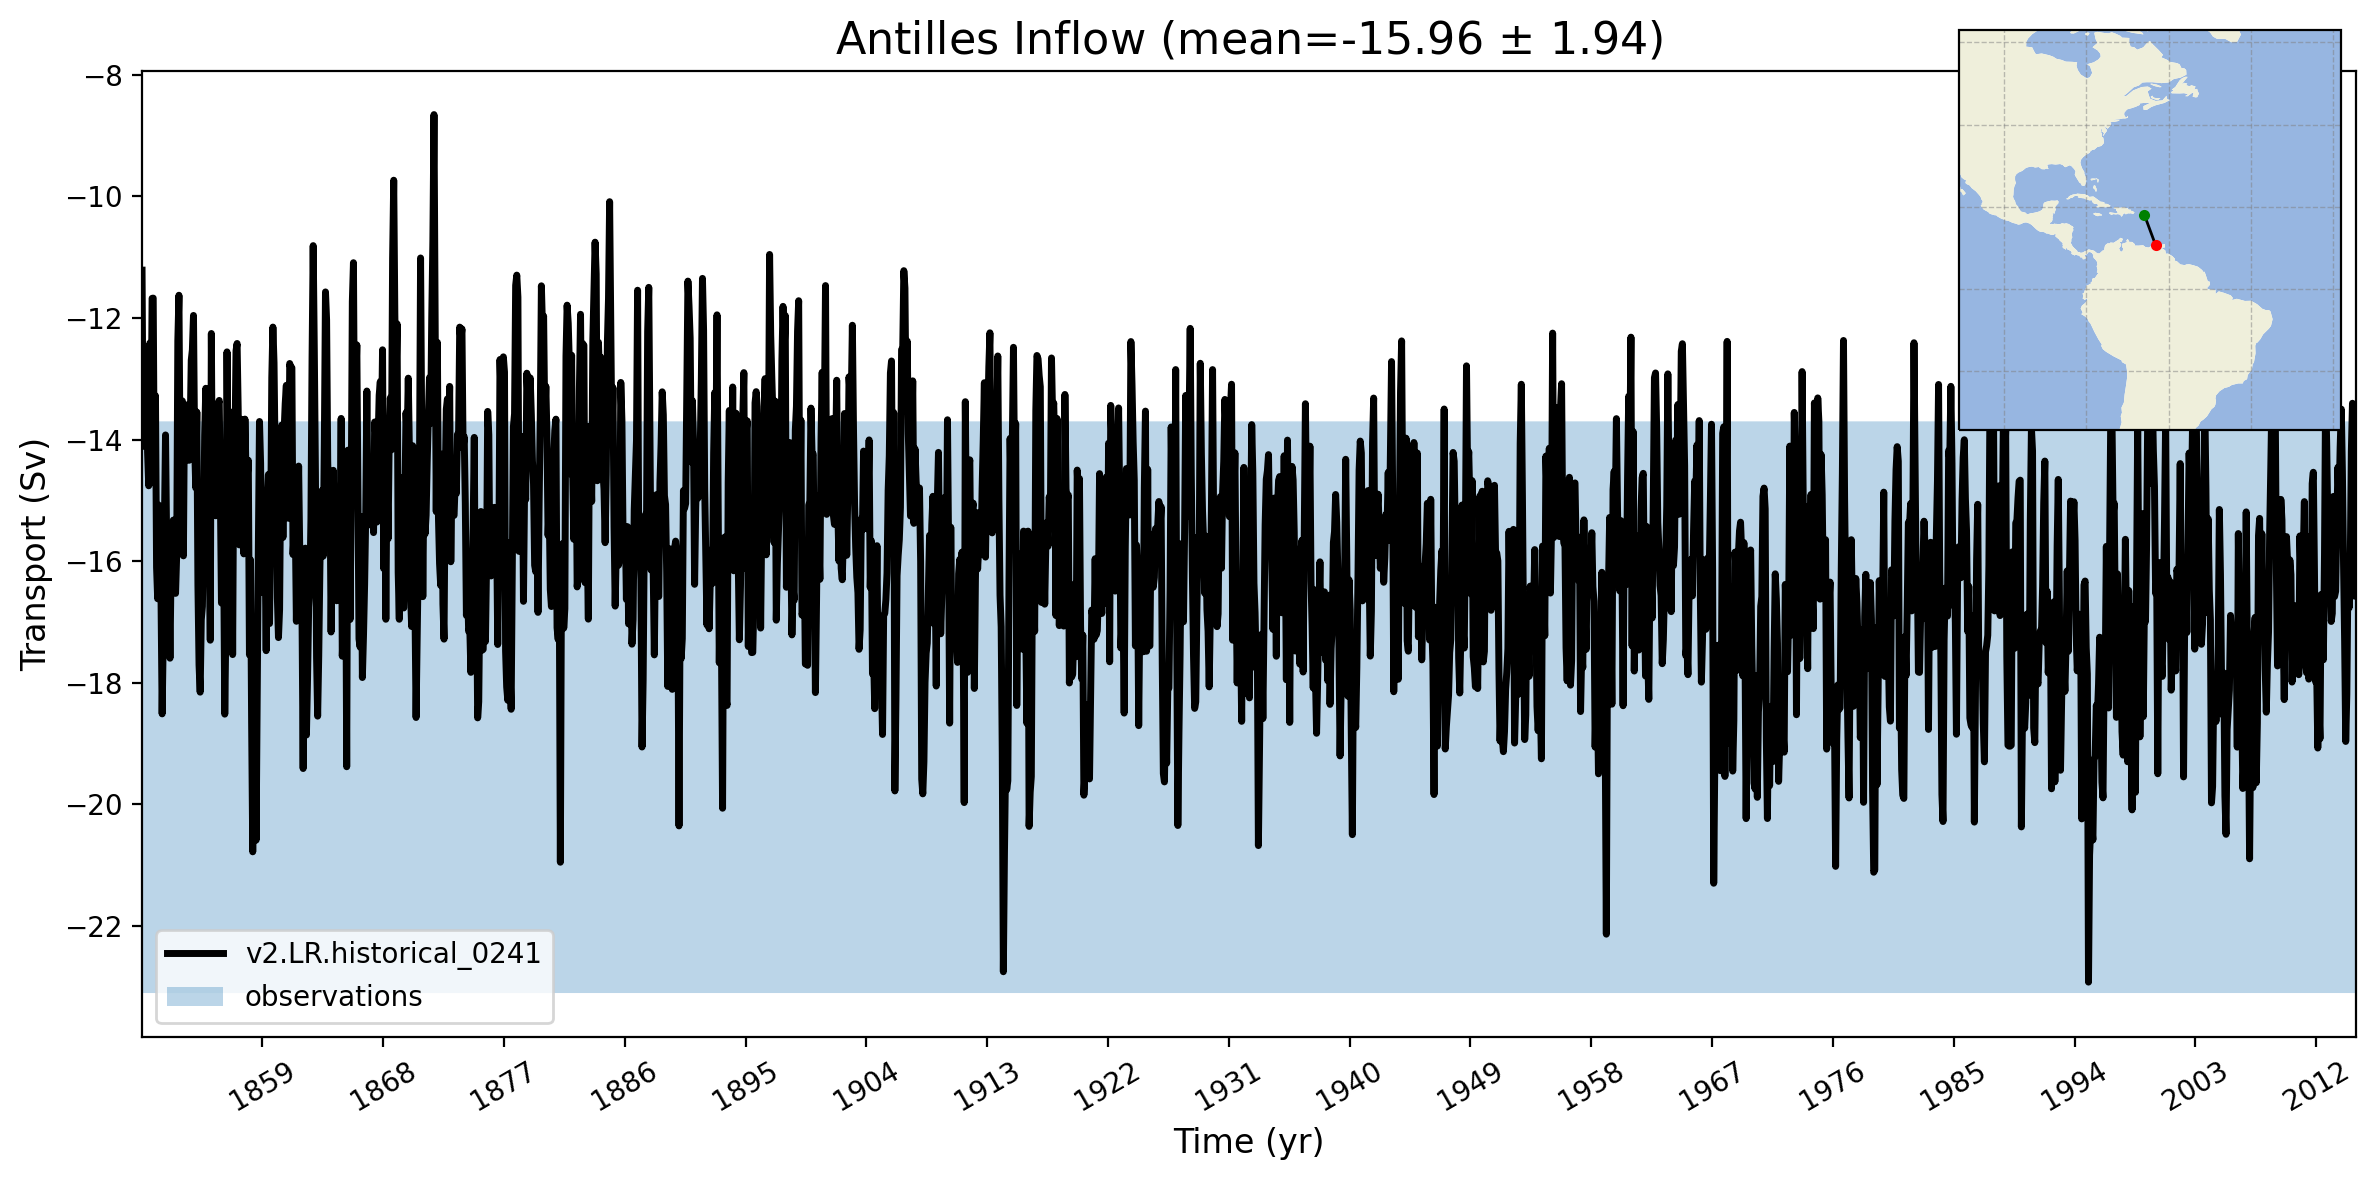
Antilles Inflow
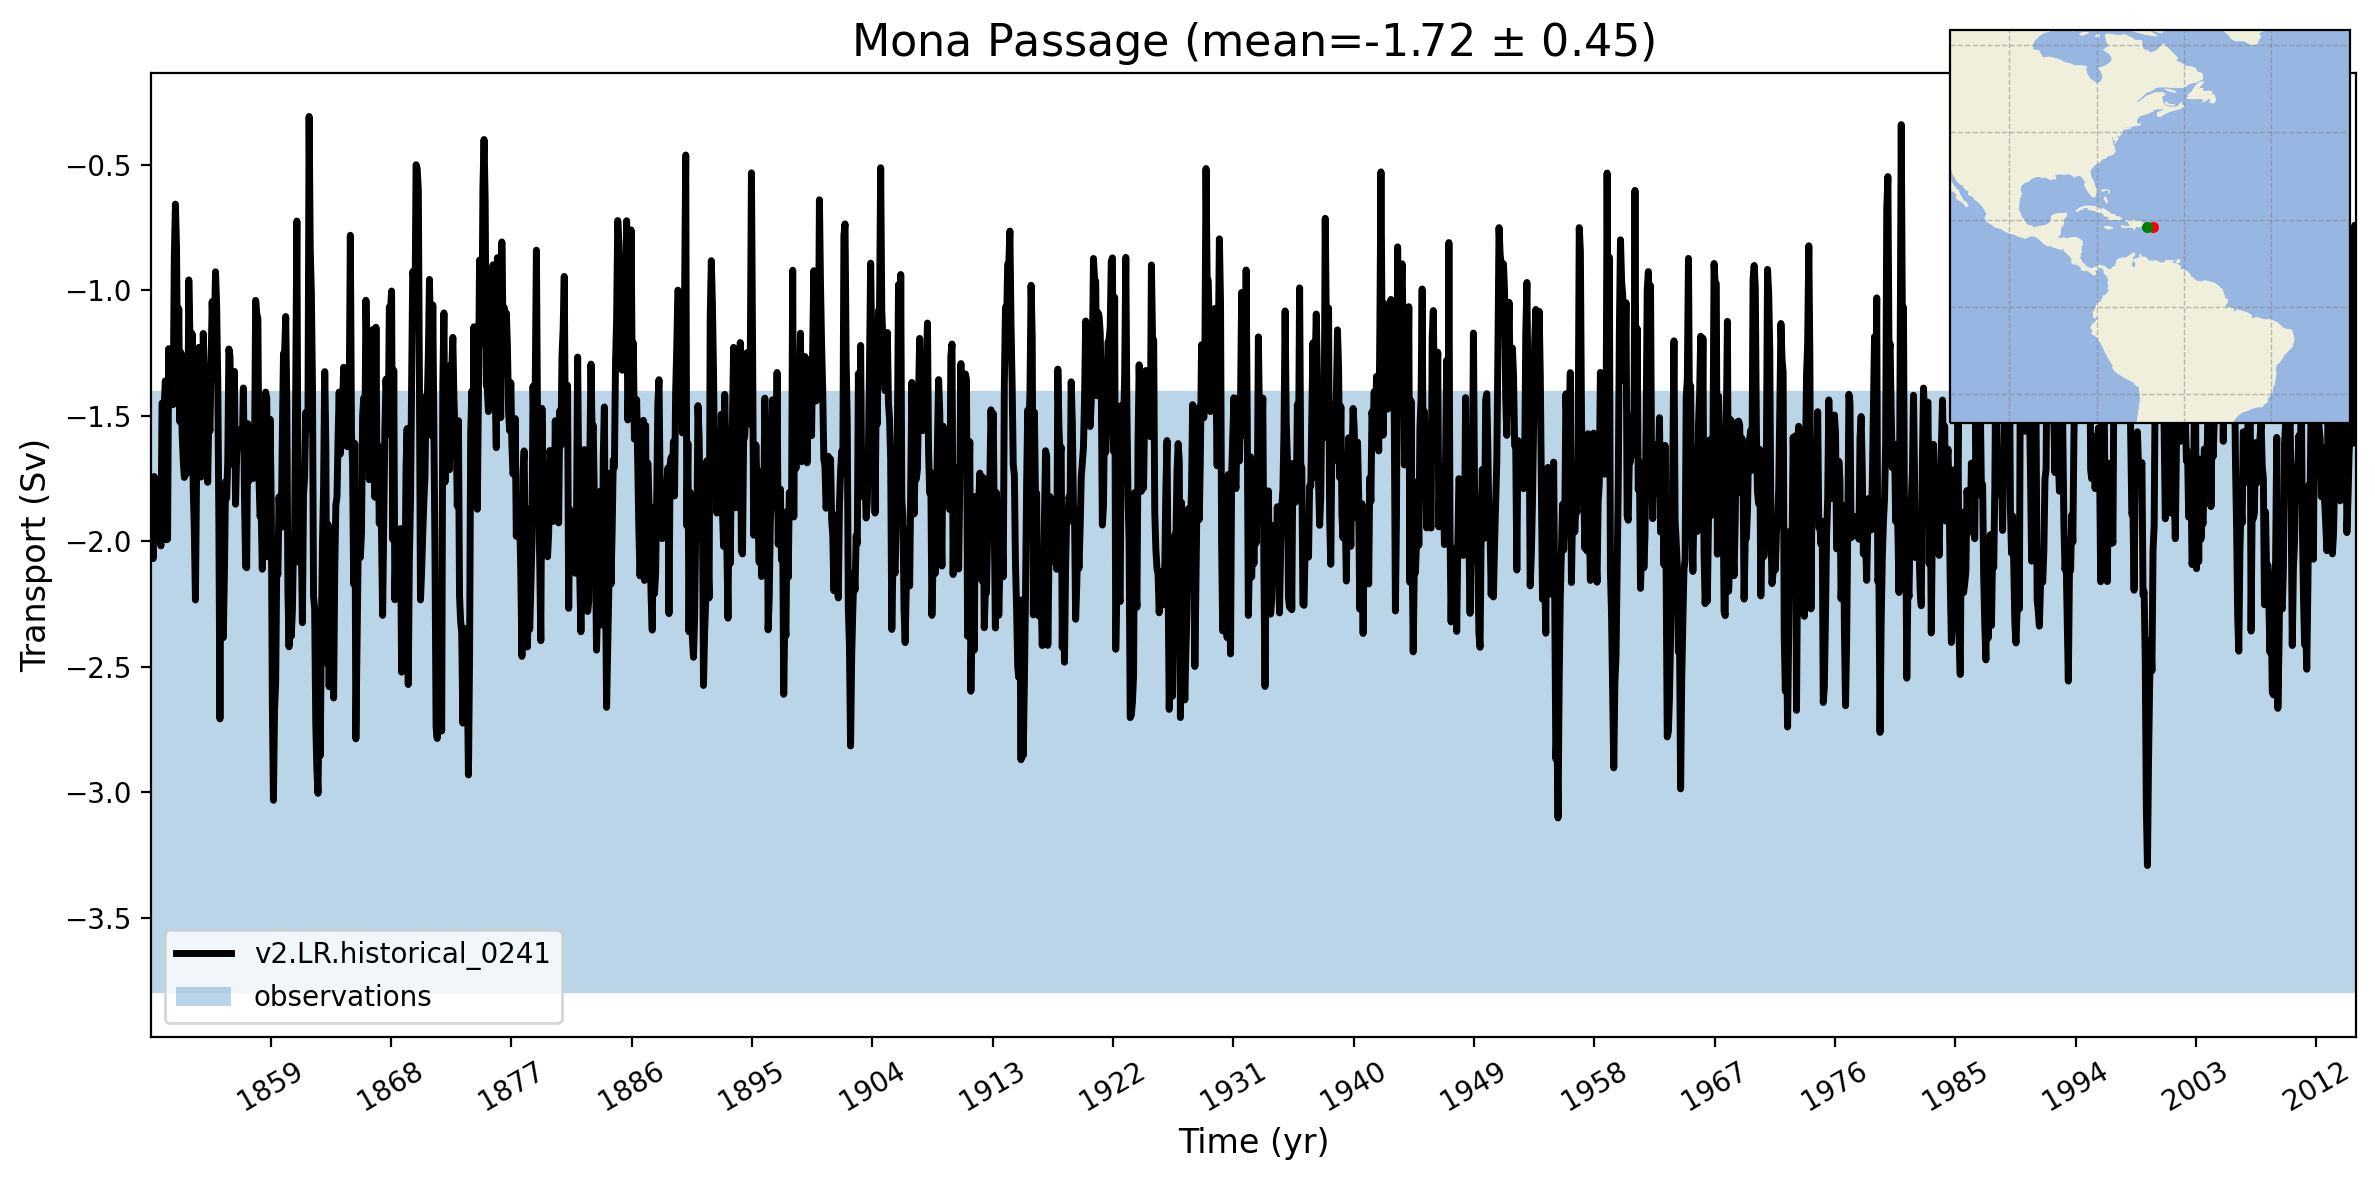
Mona Passage
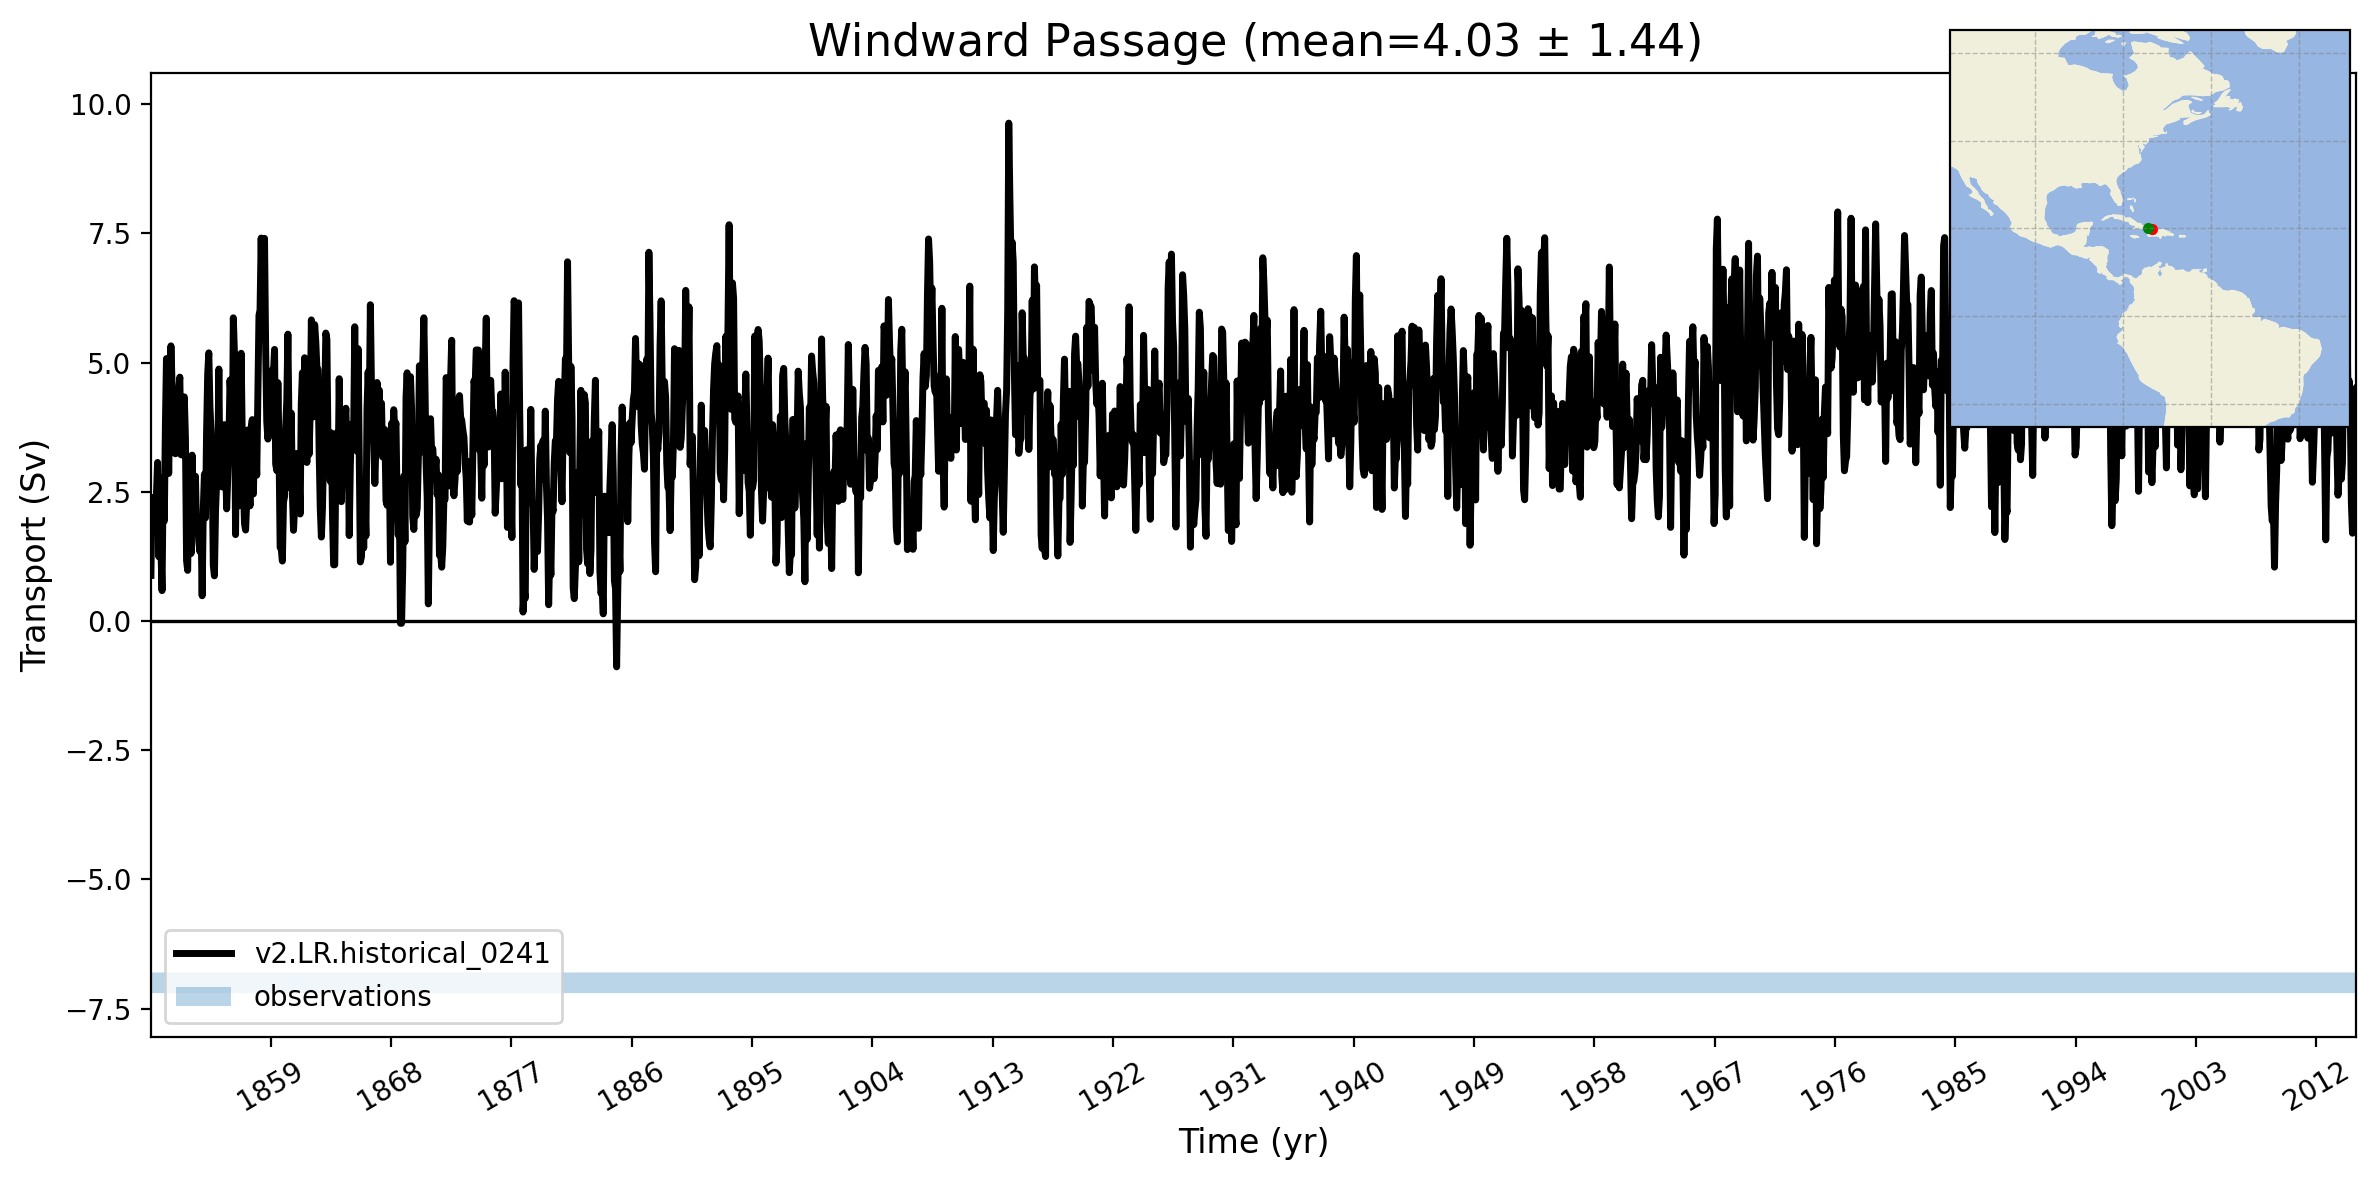
Windward Passage
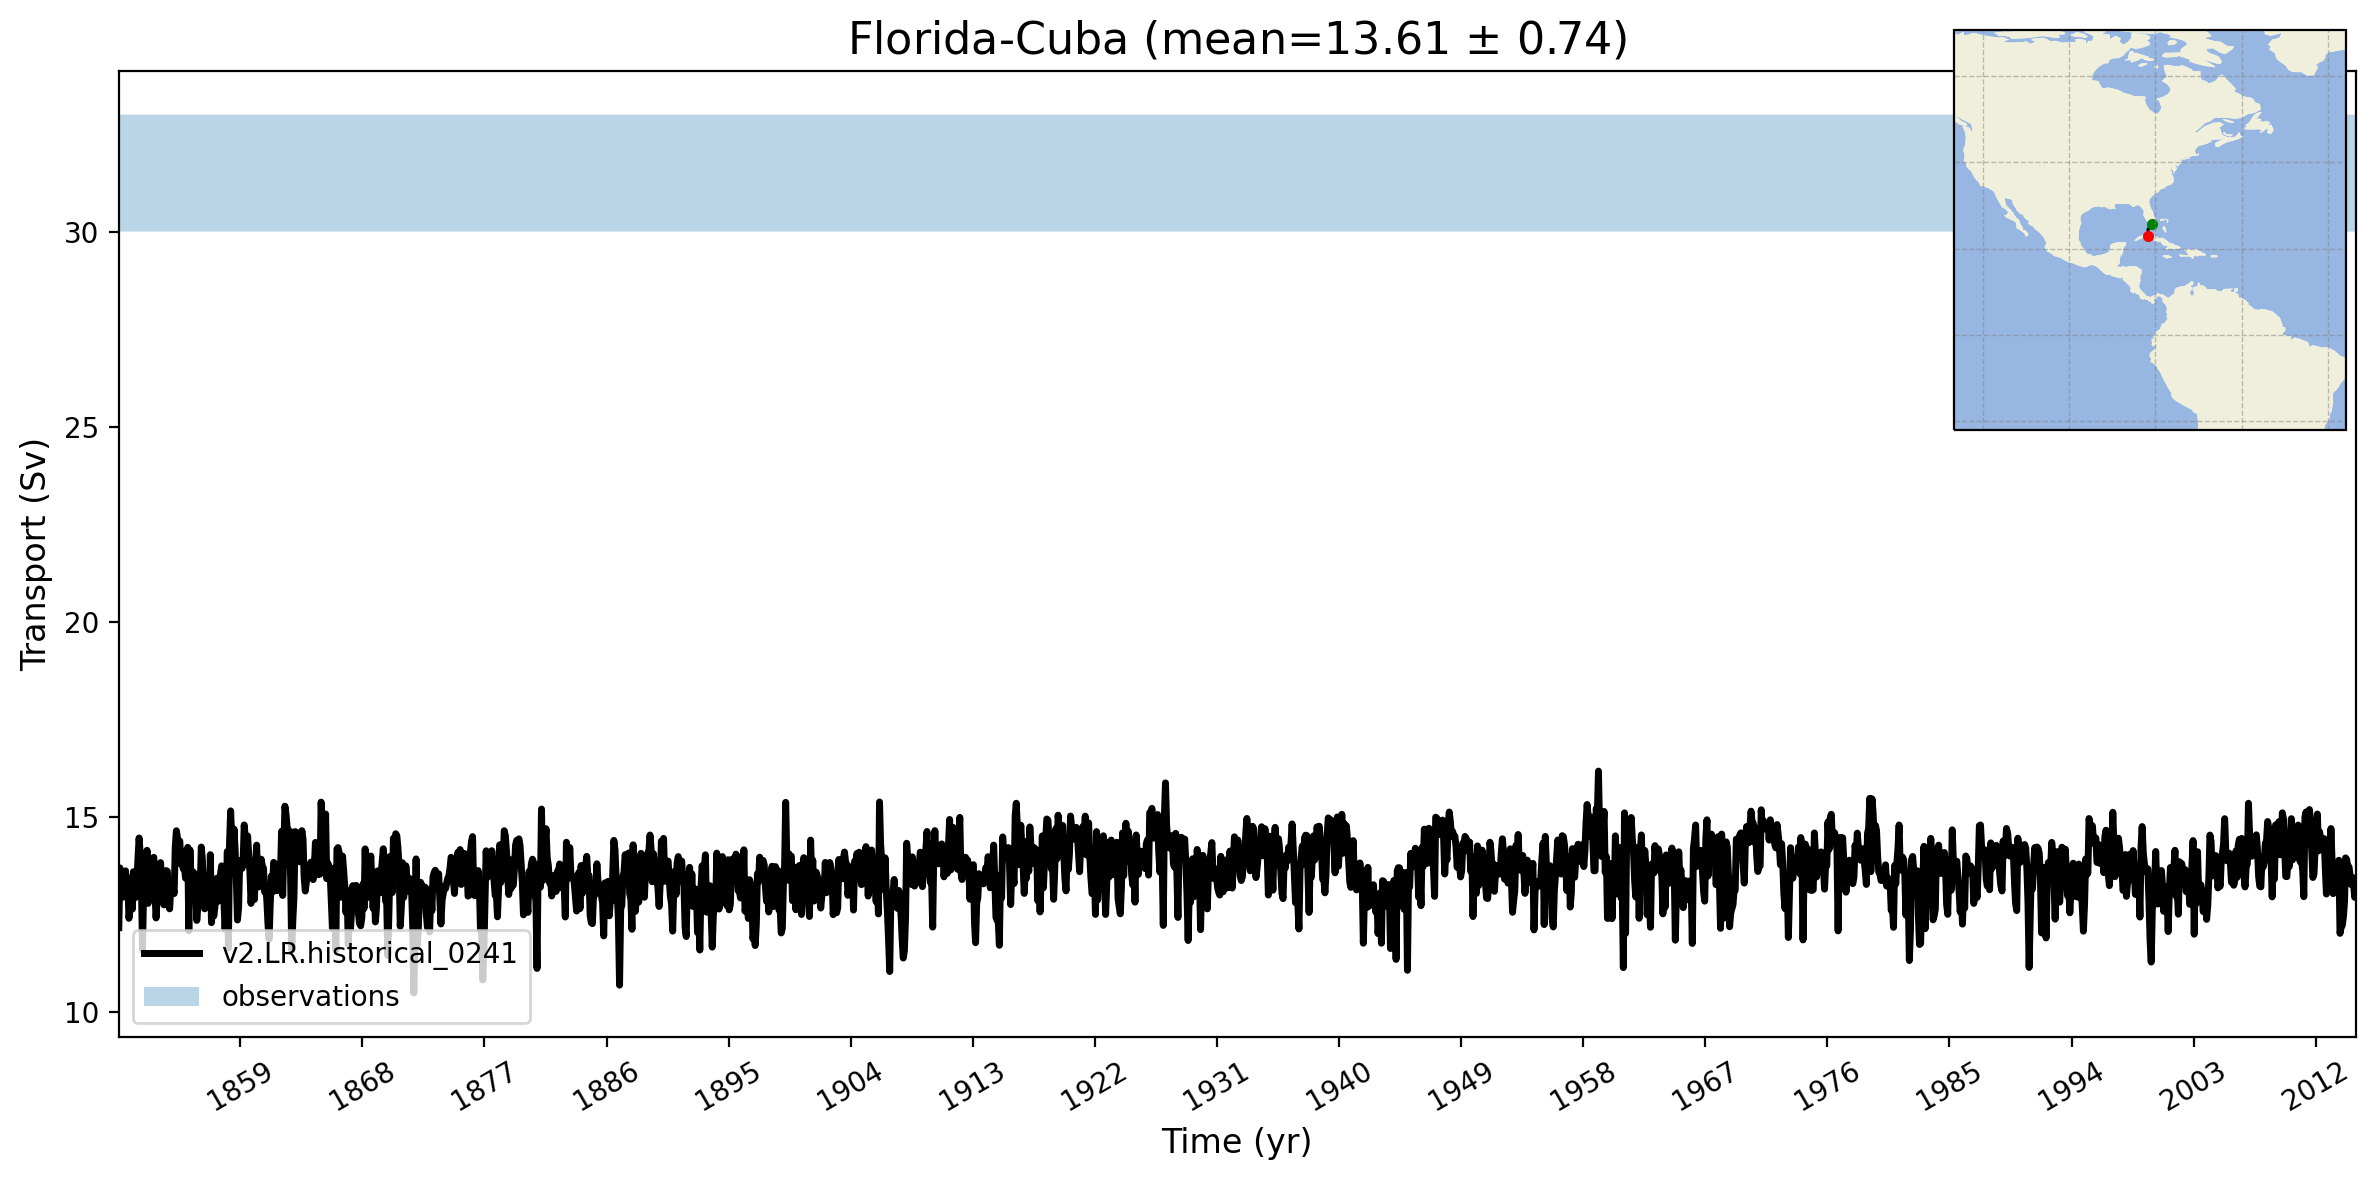
Florida-Cuba
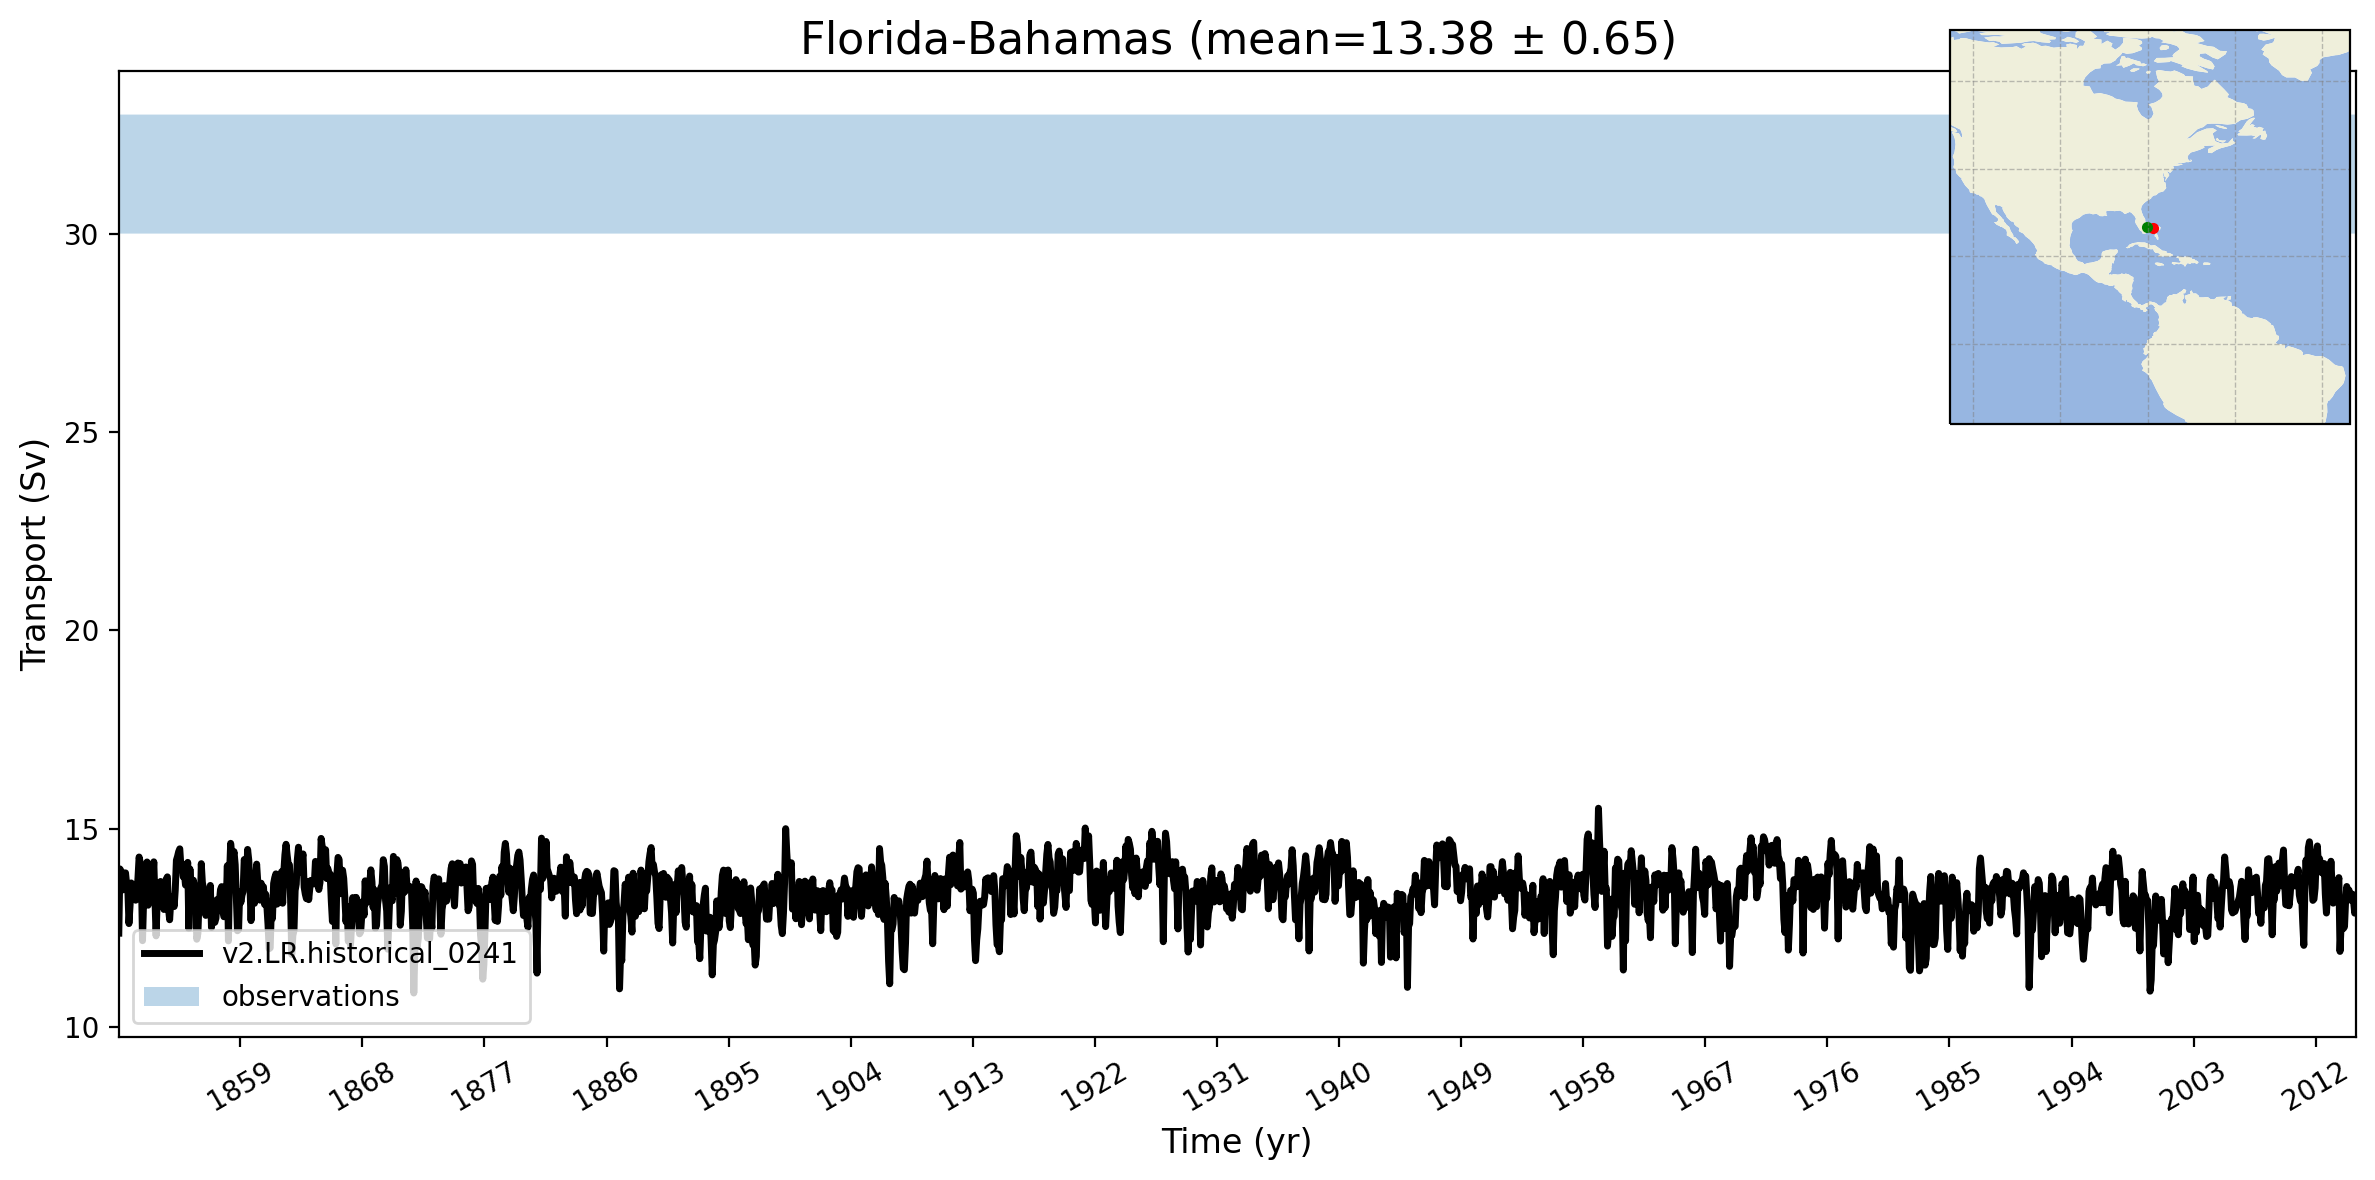
Florida-Bahamas
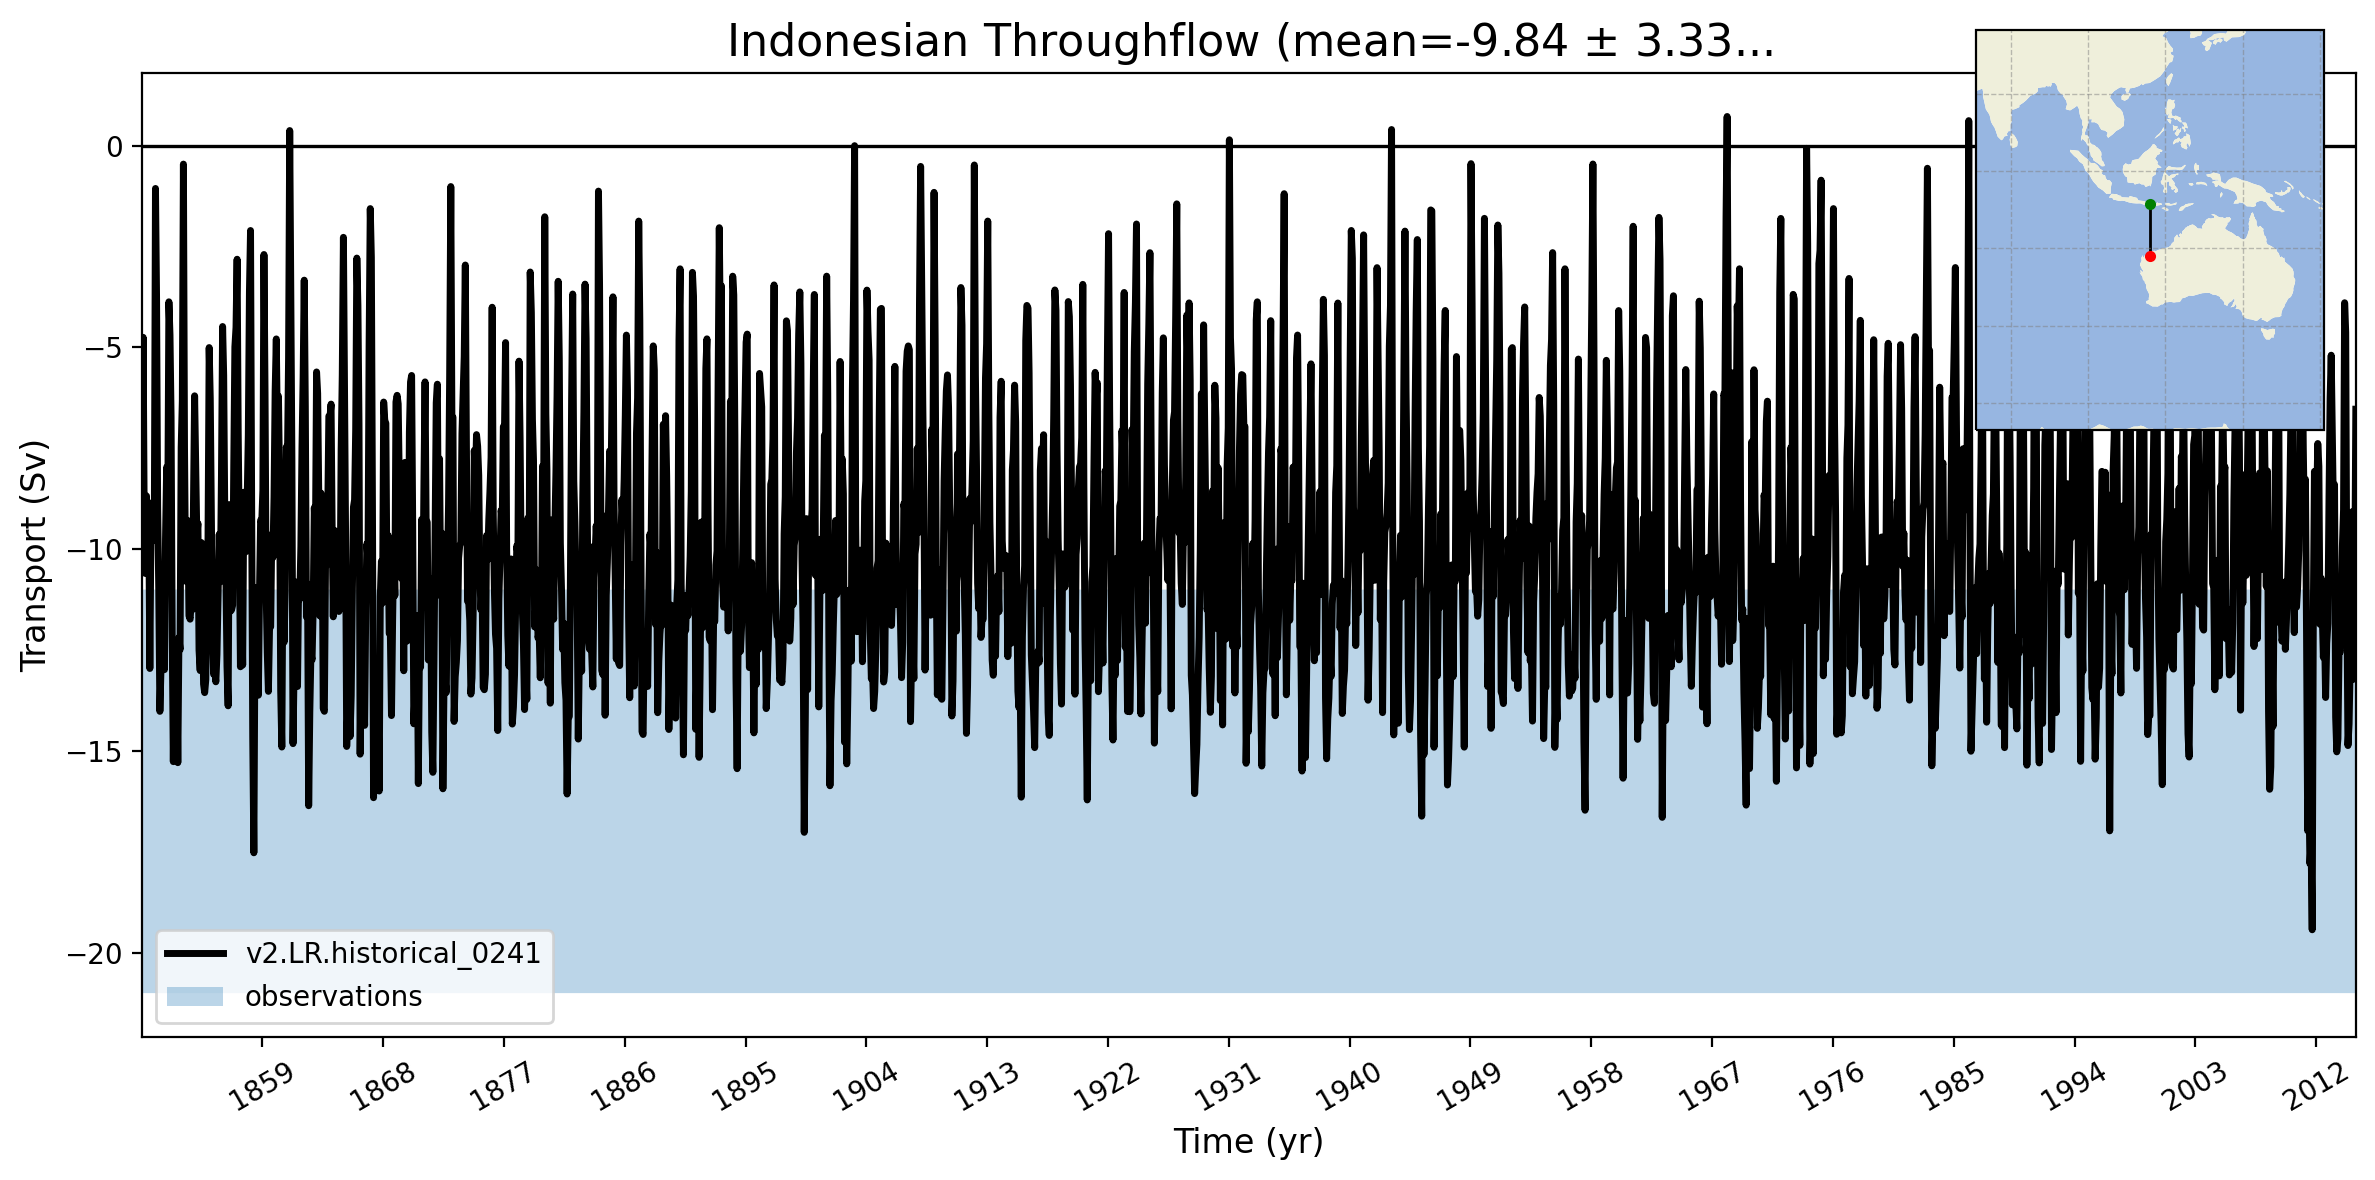
Indonesian Throughflow
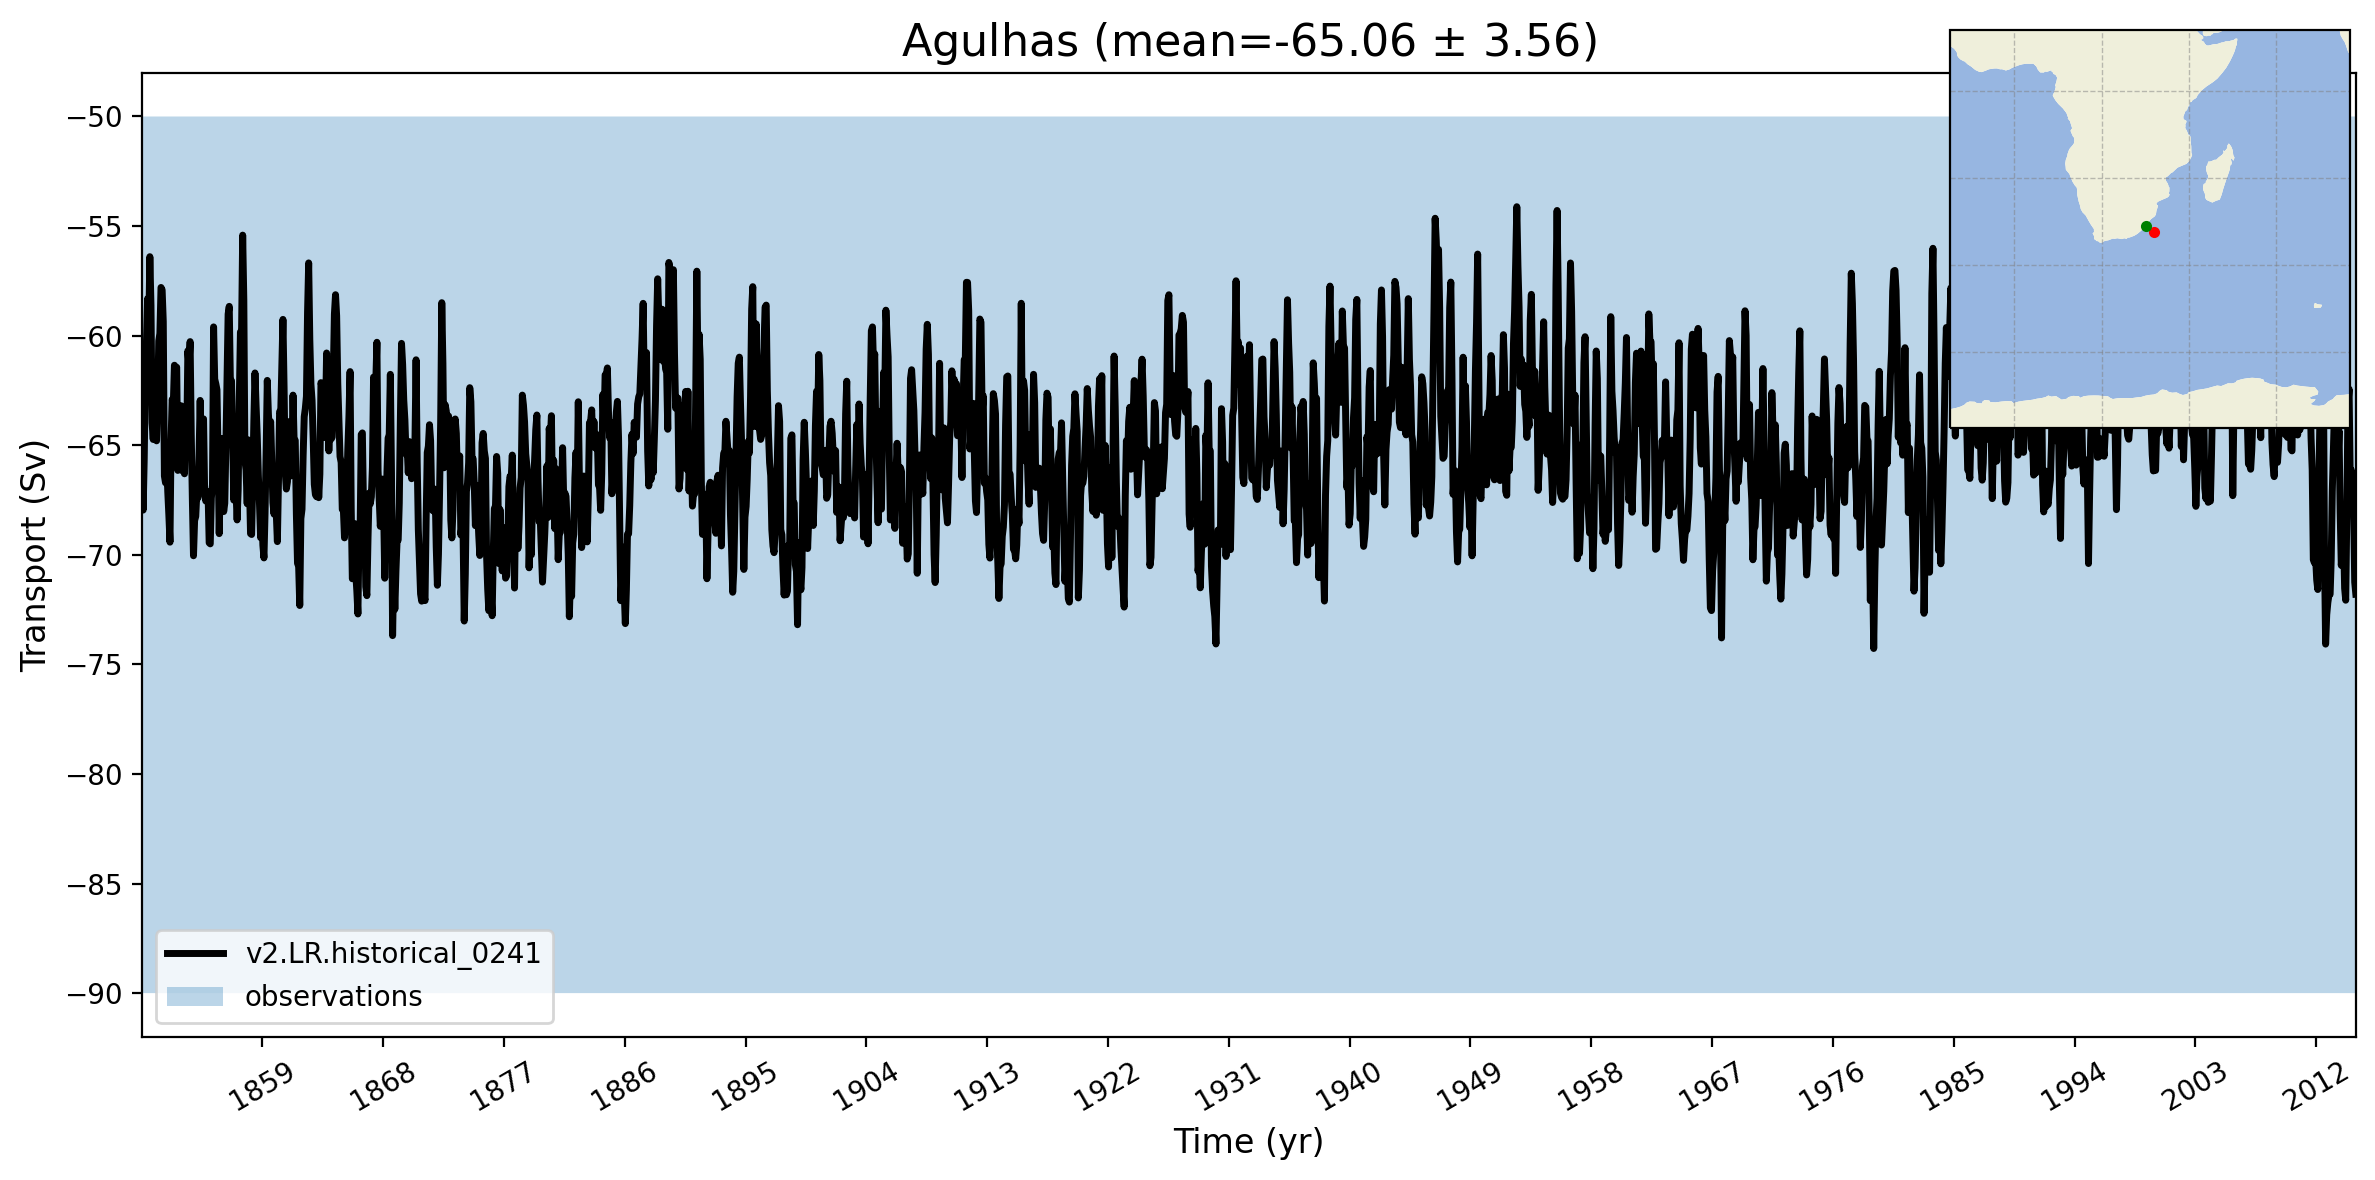
Agulhas
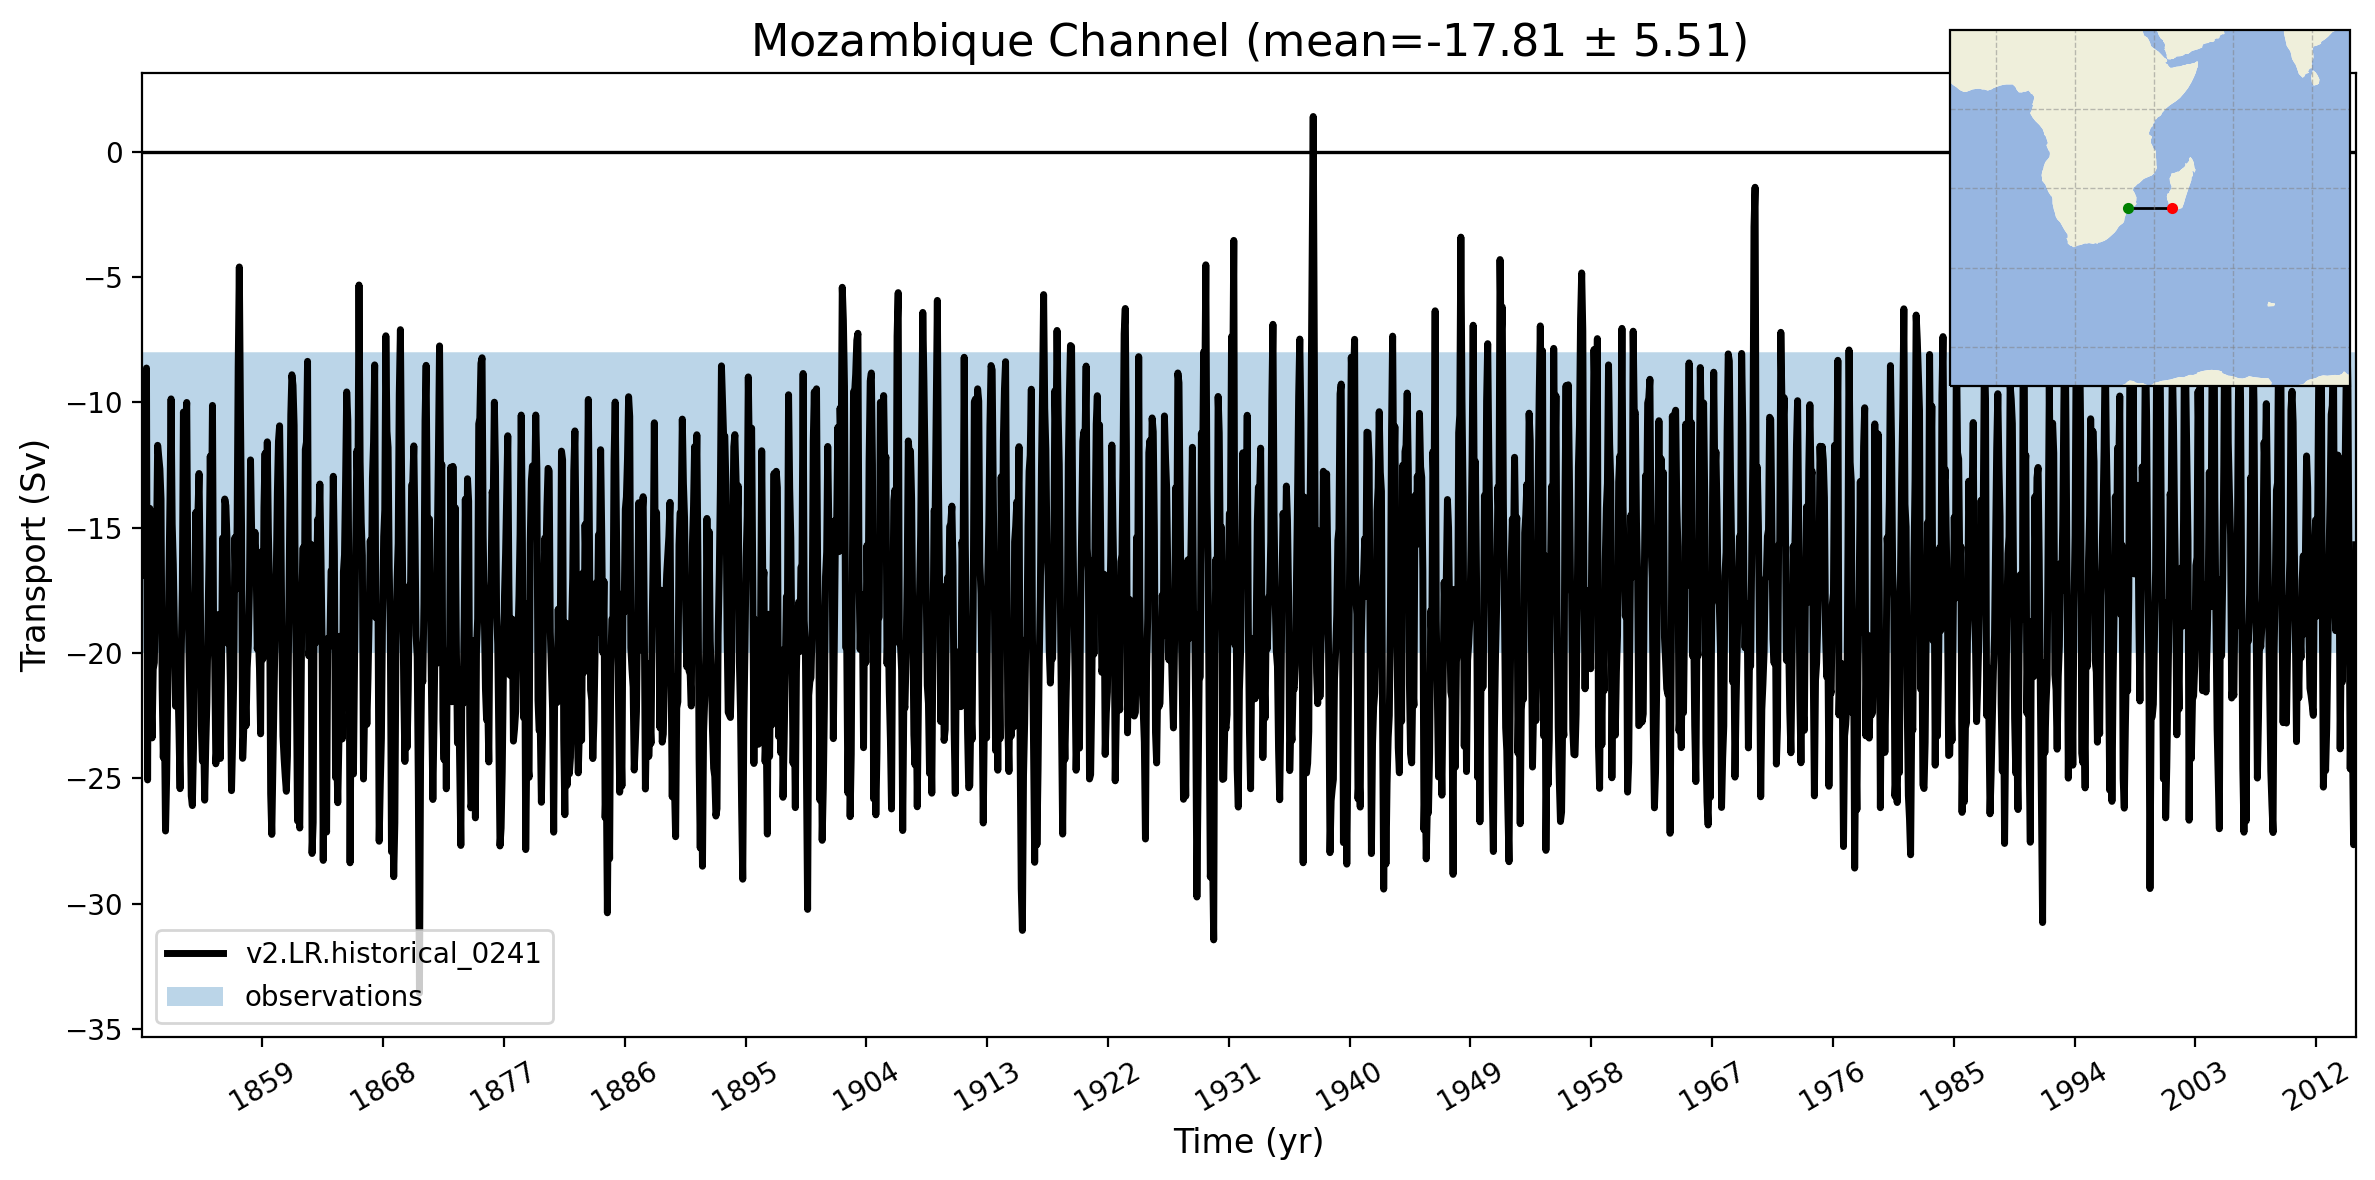
Mozambique Channel
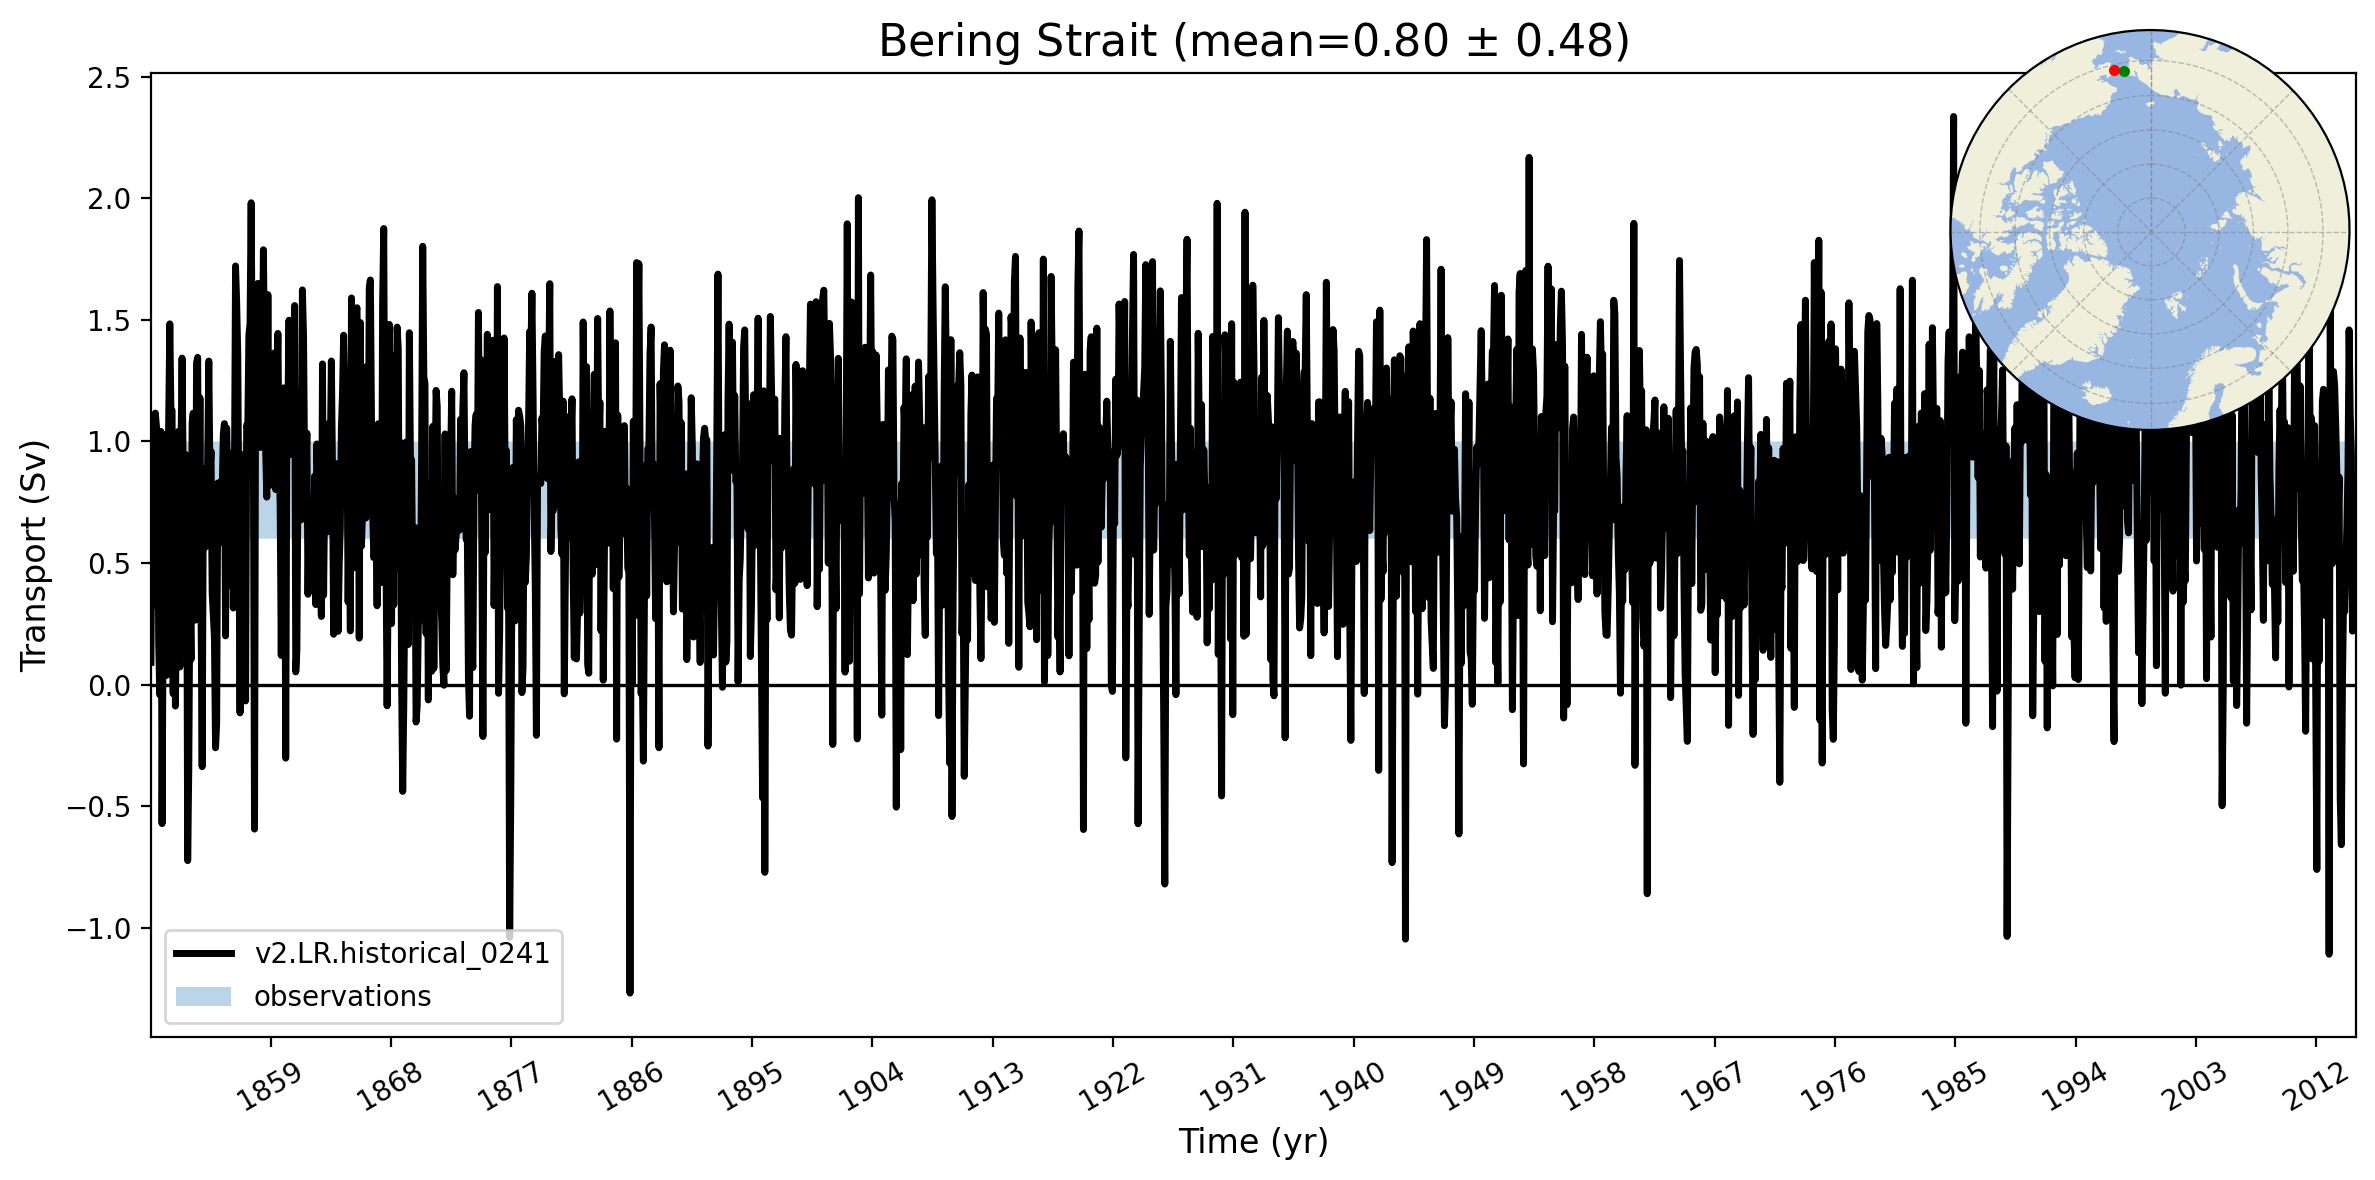
Bering Strait
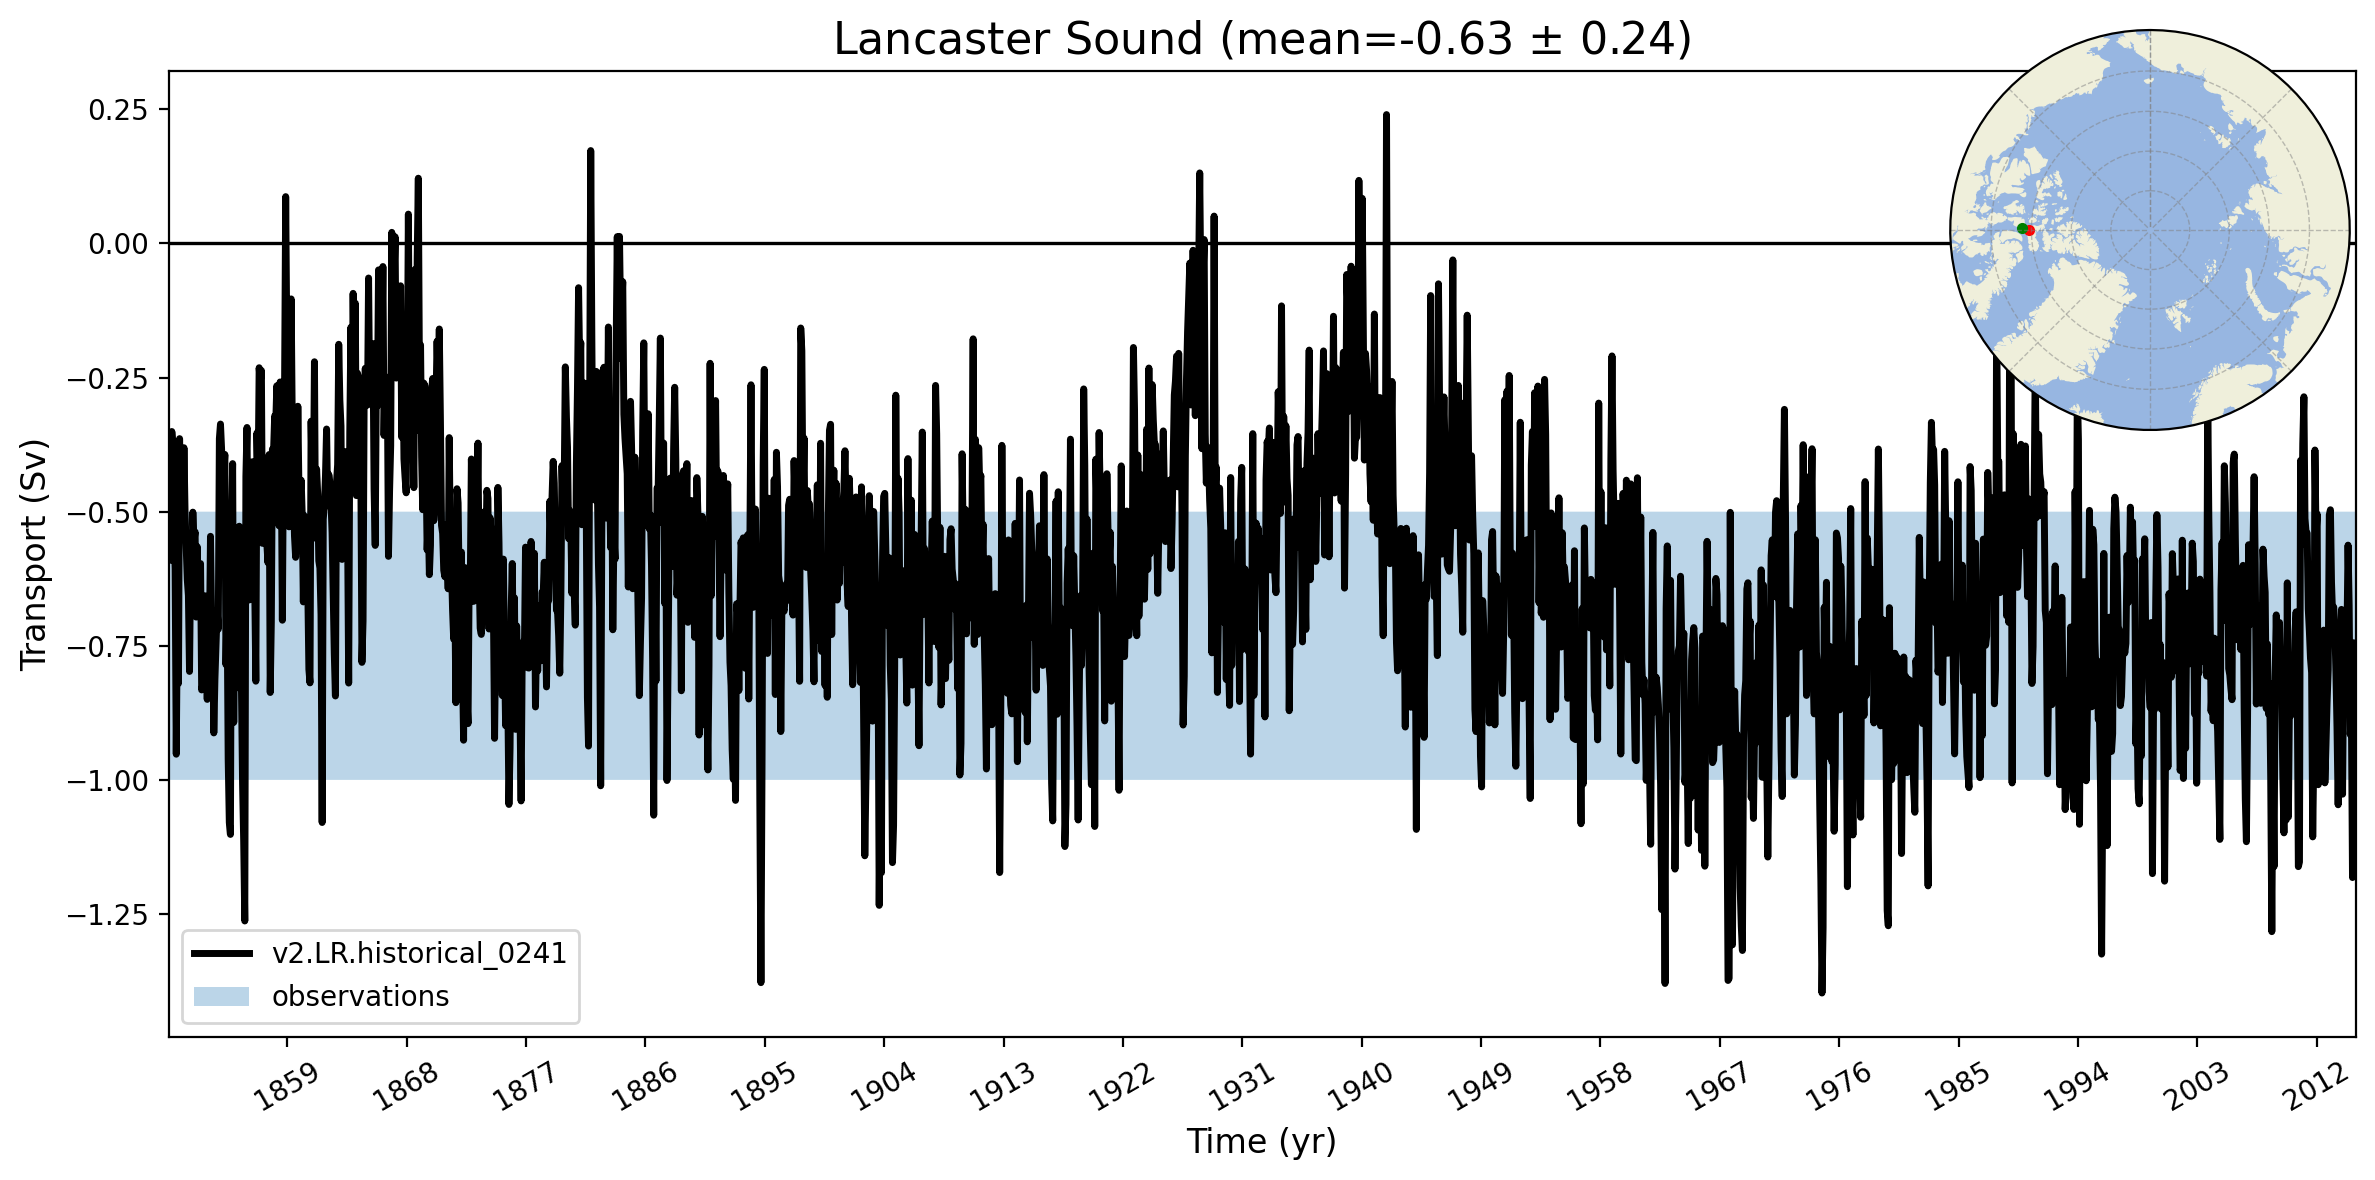
Lancaster Sound
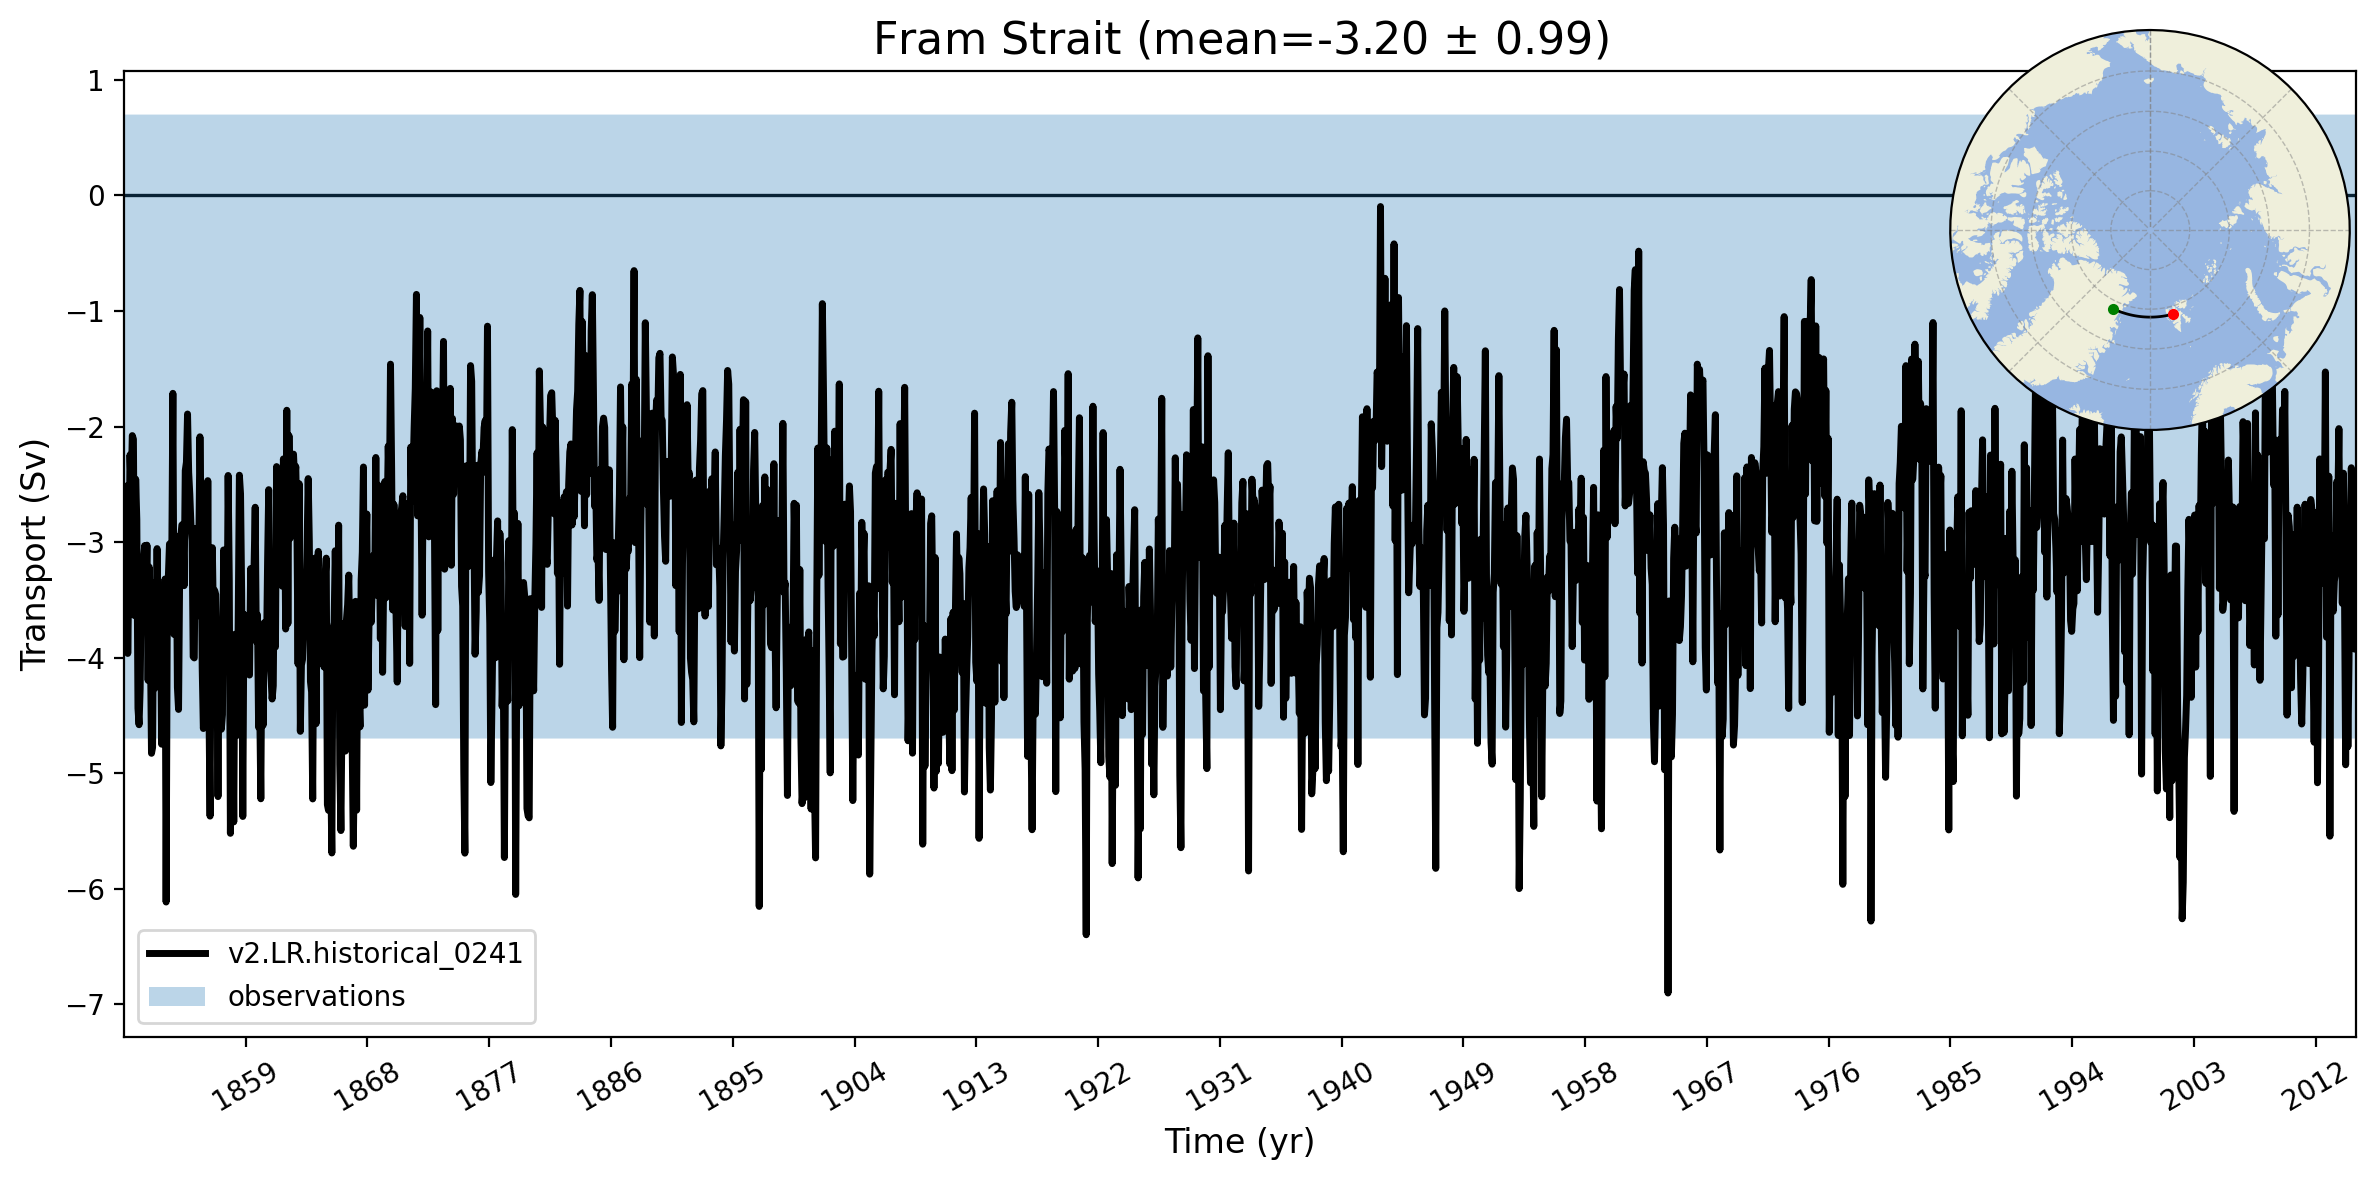
Fram Strait
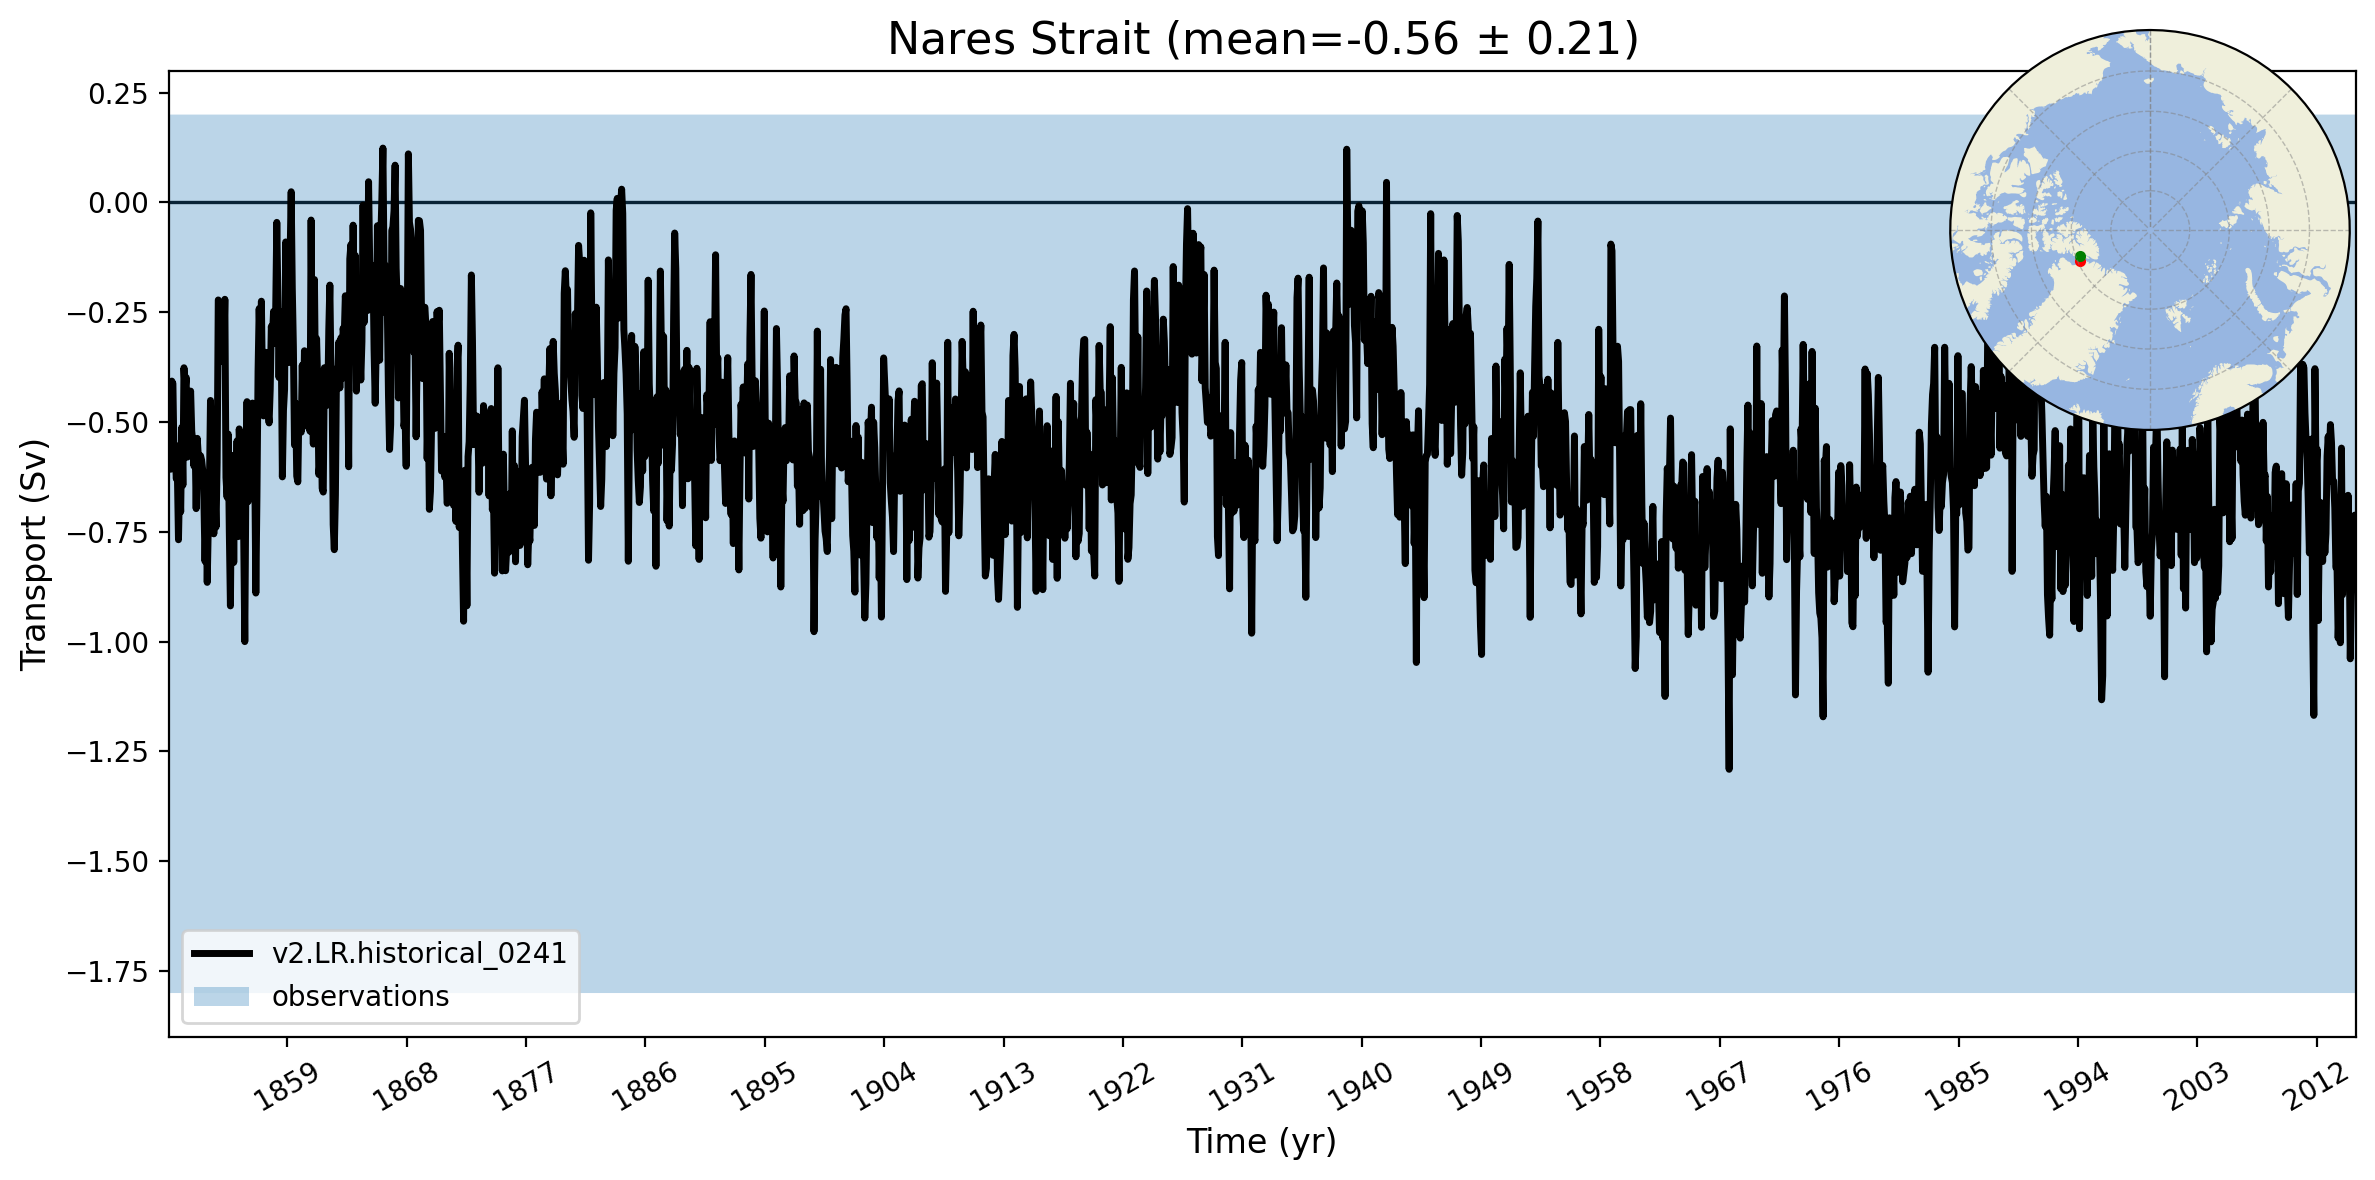
Nares Strait
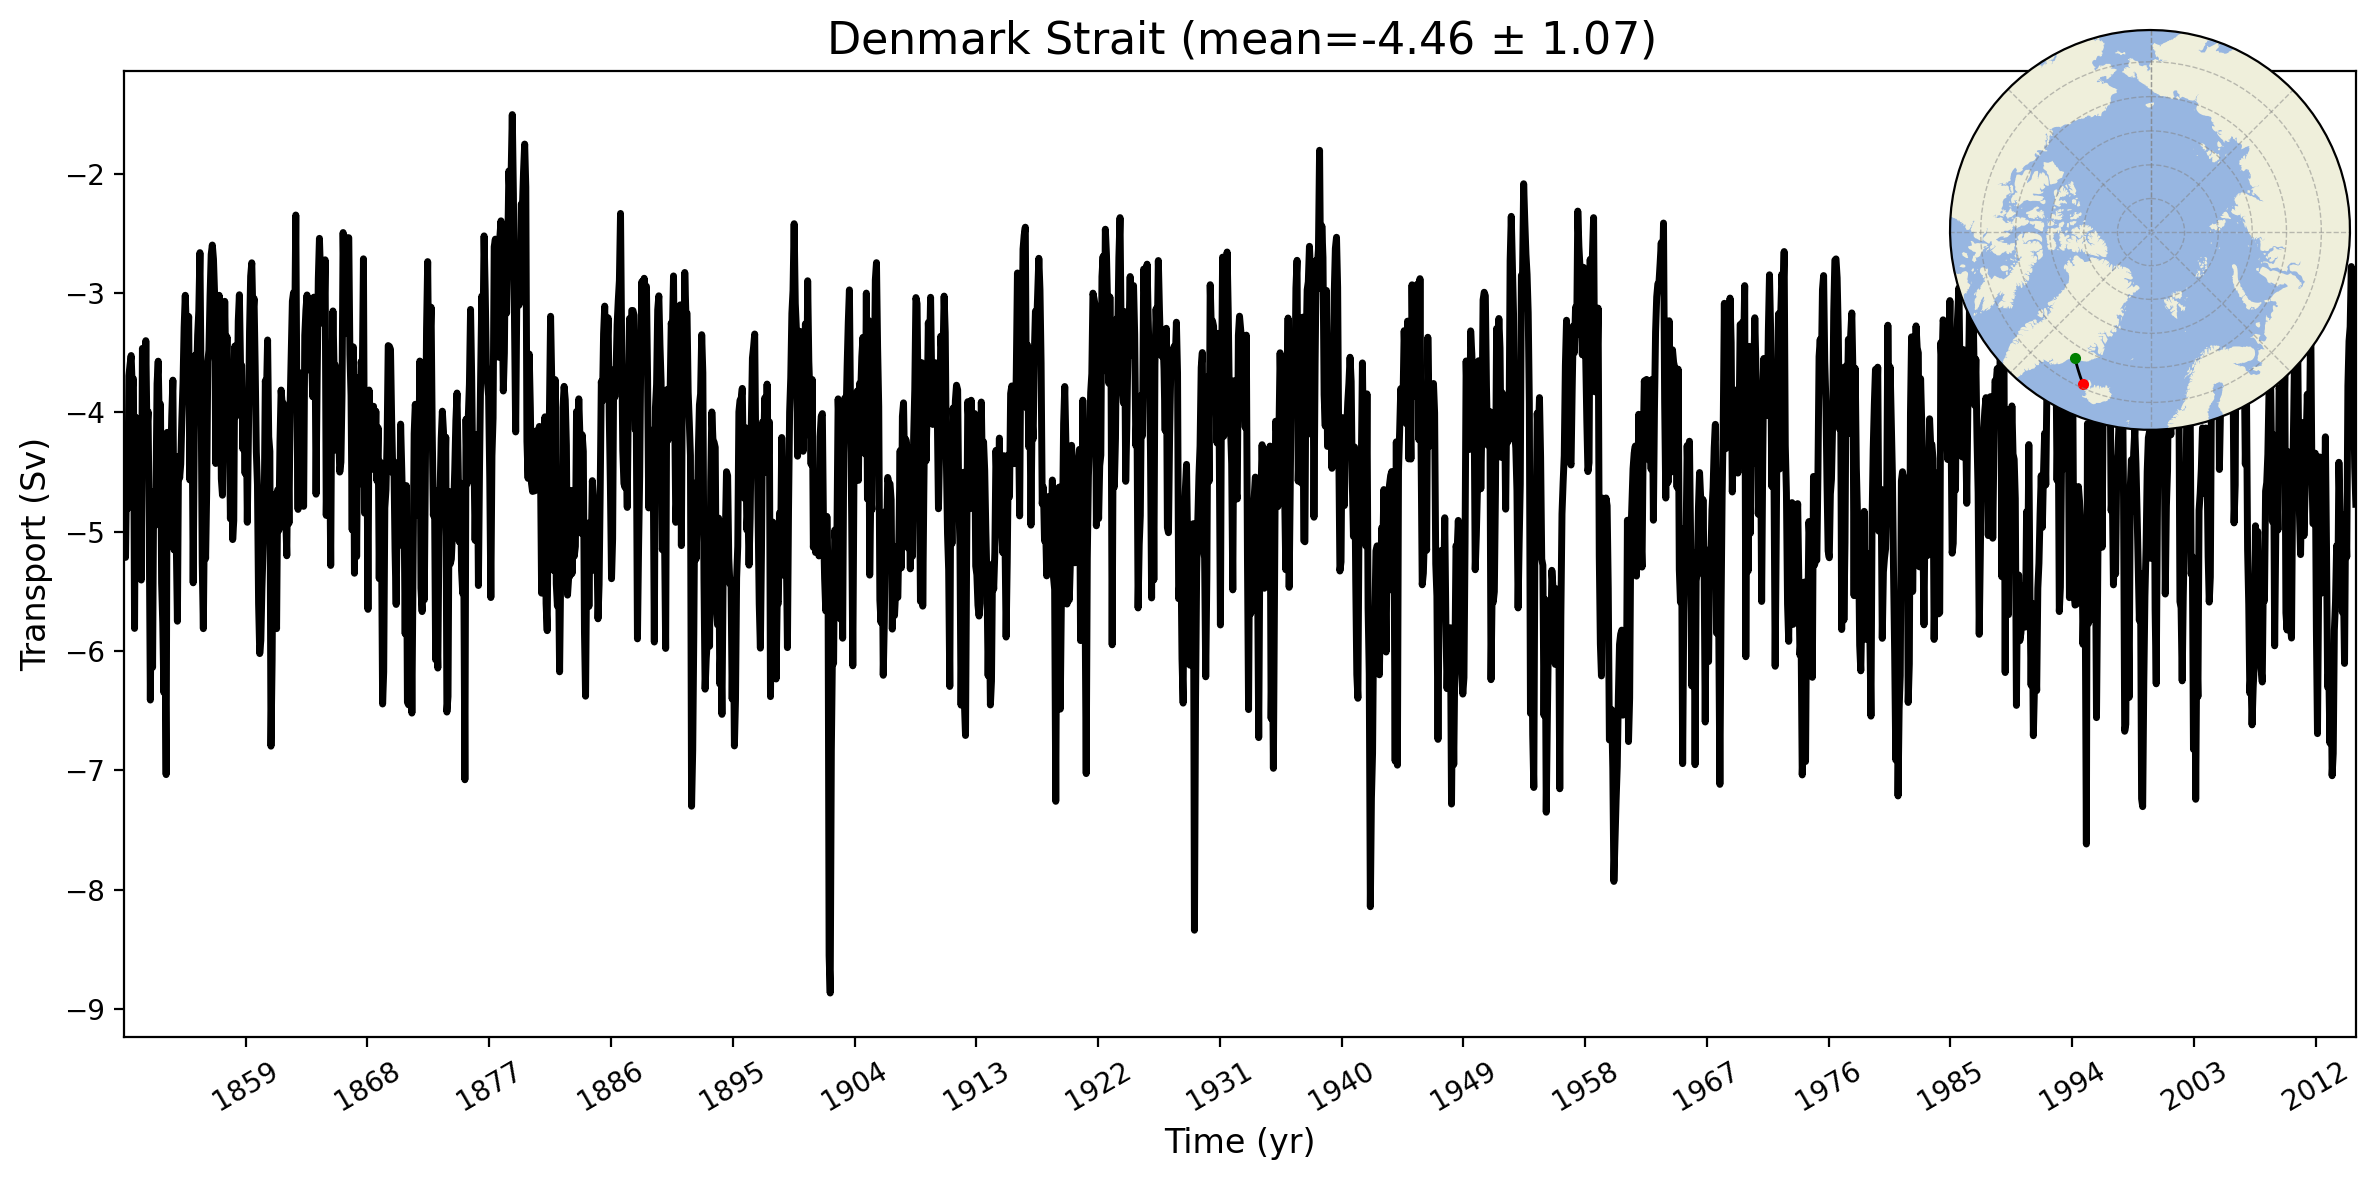
Denmark Strait
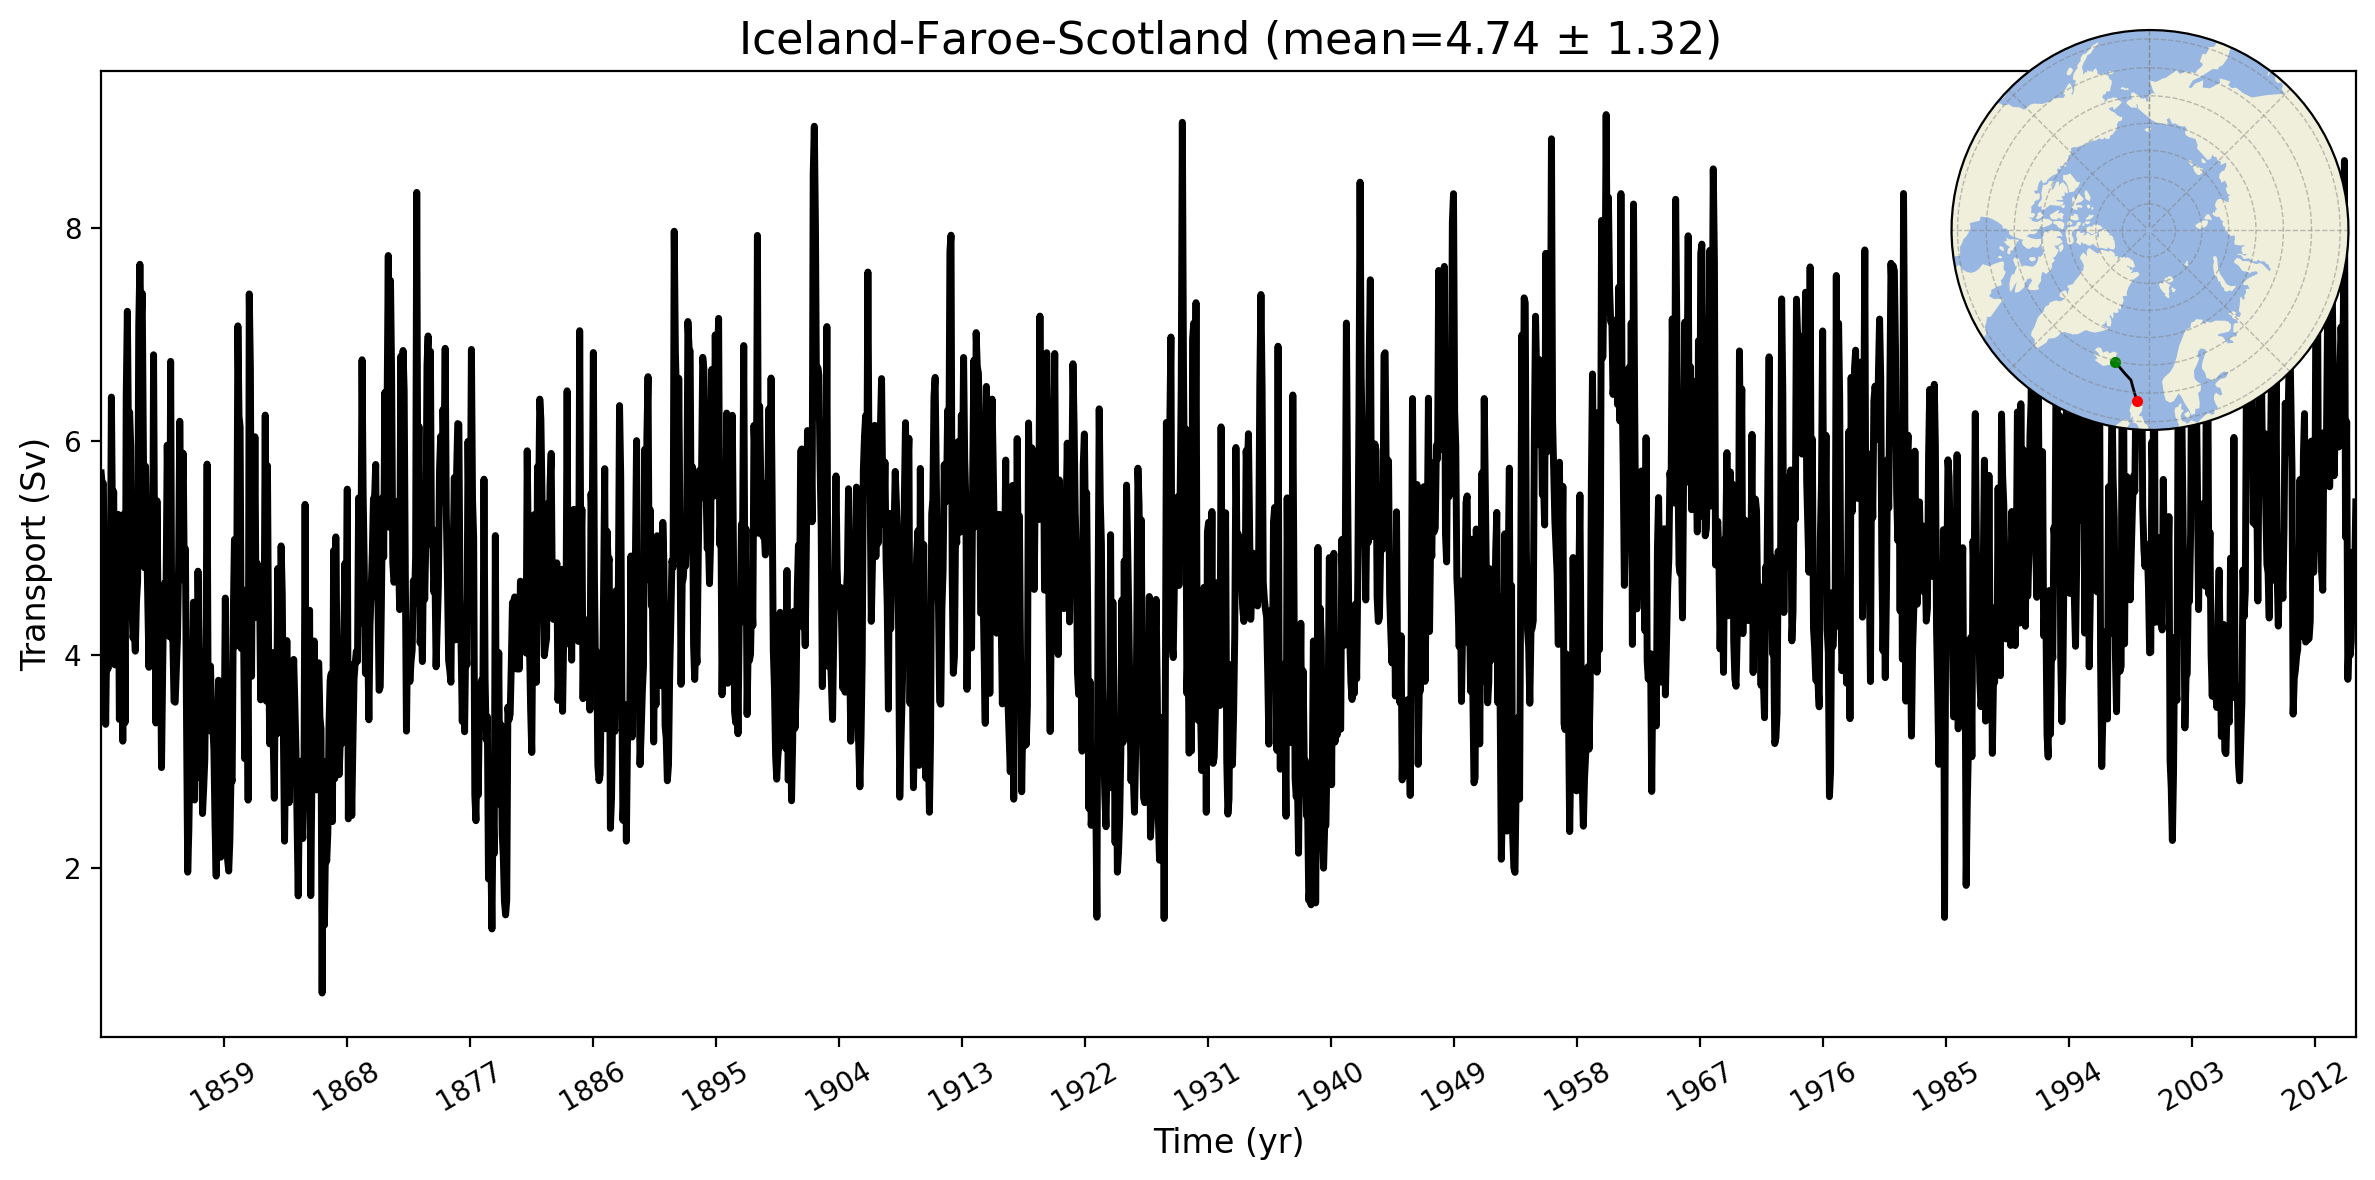
Iceland-Faroe-Scotland
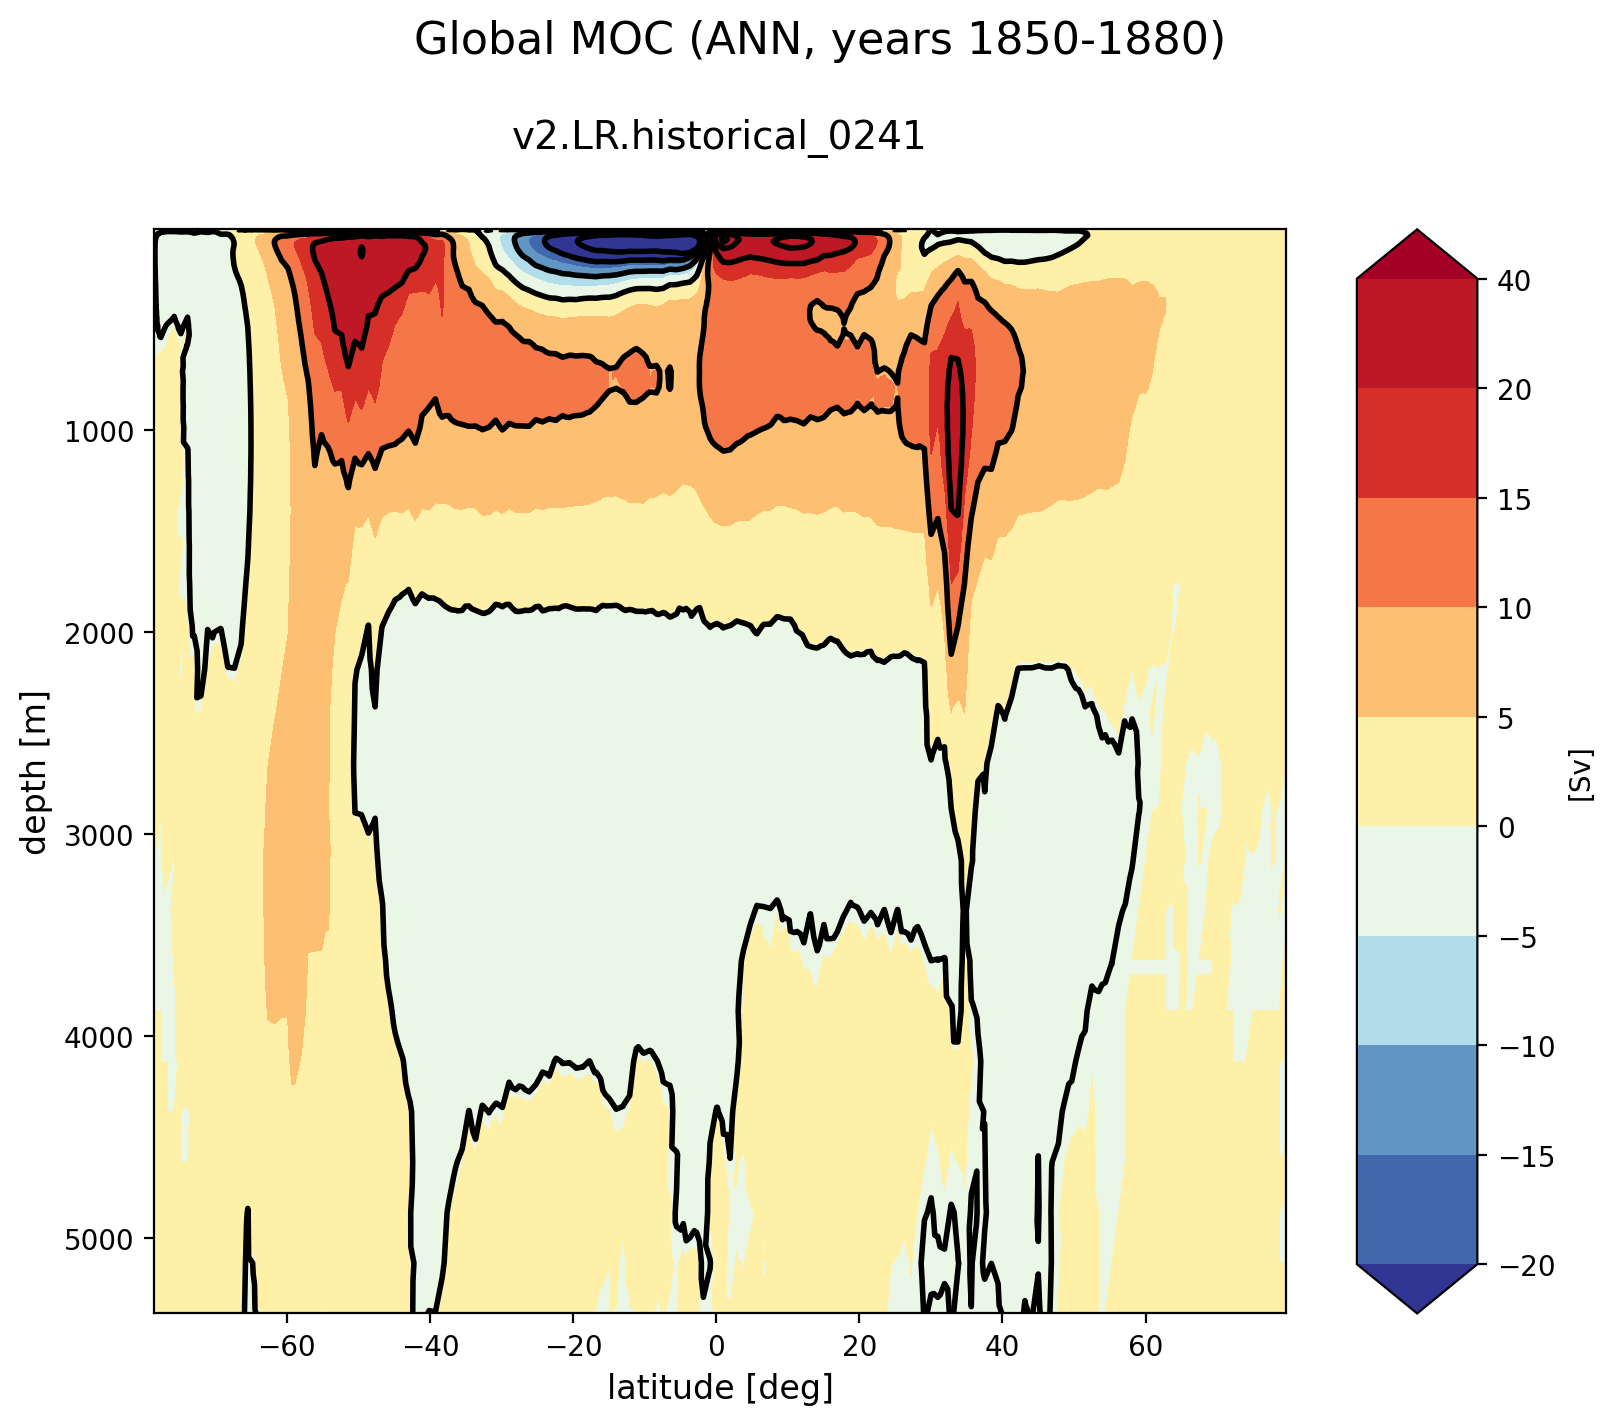
Global
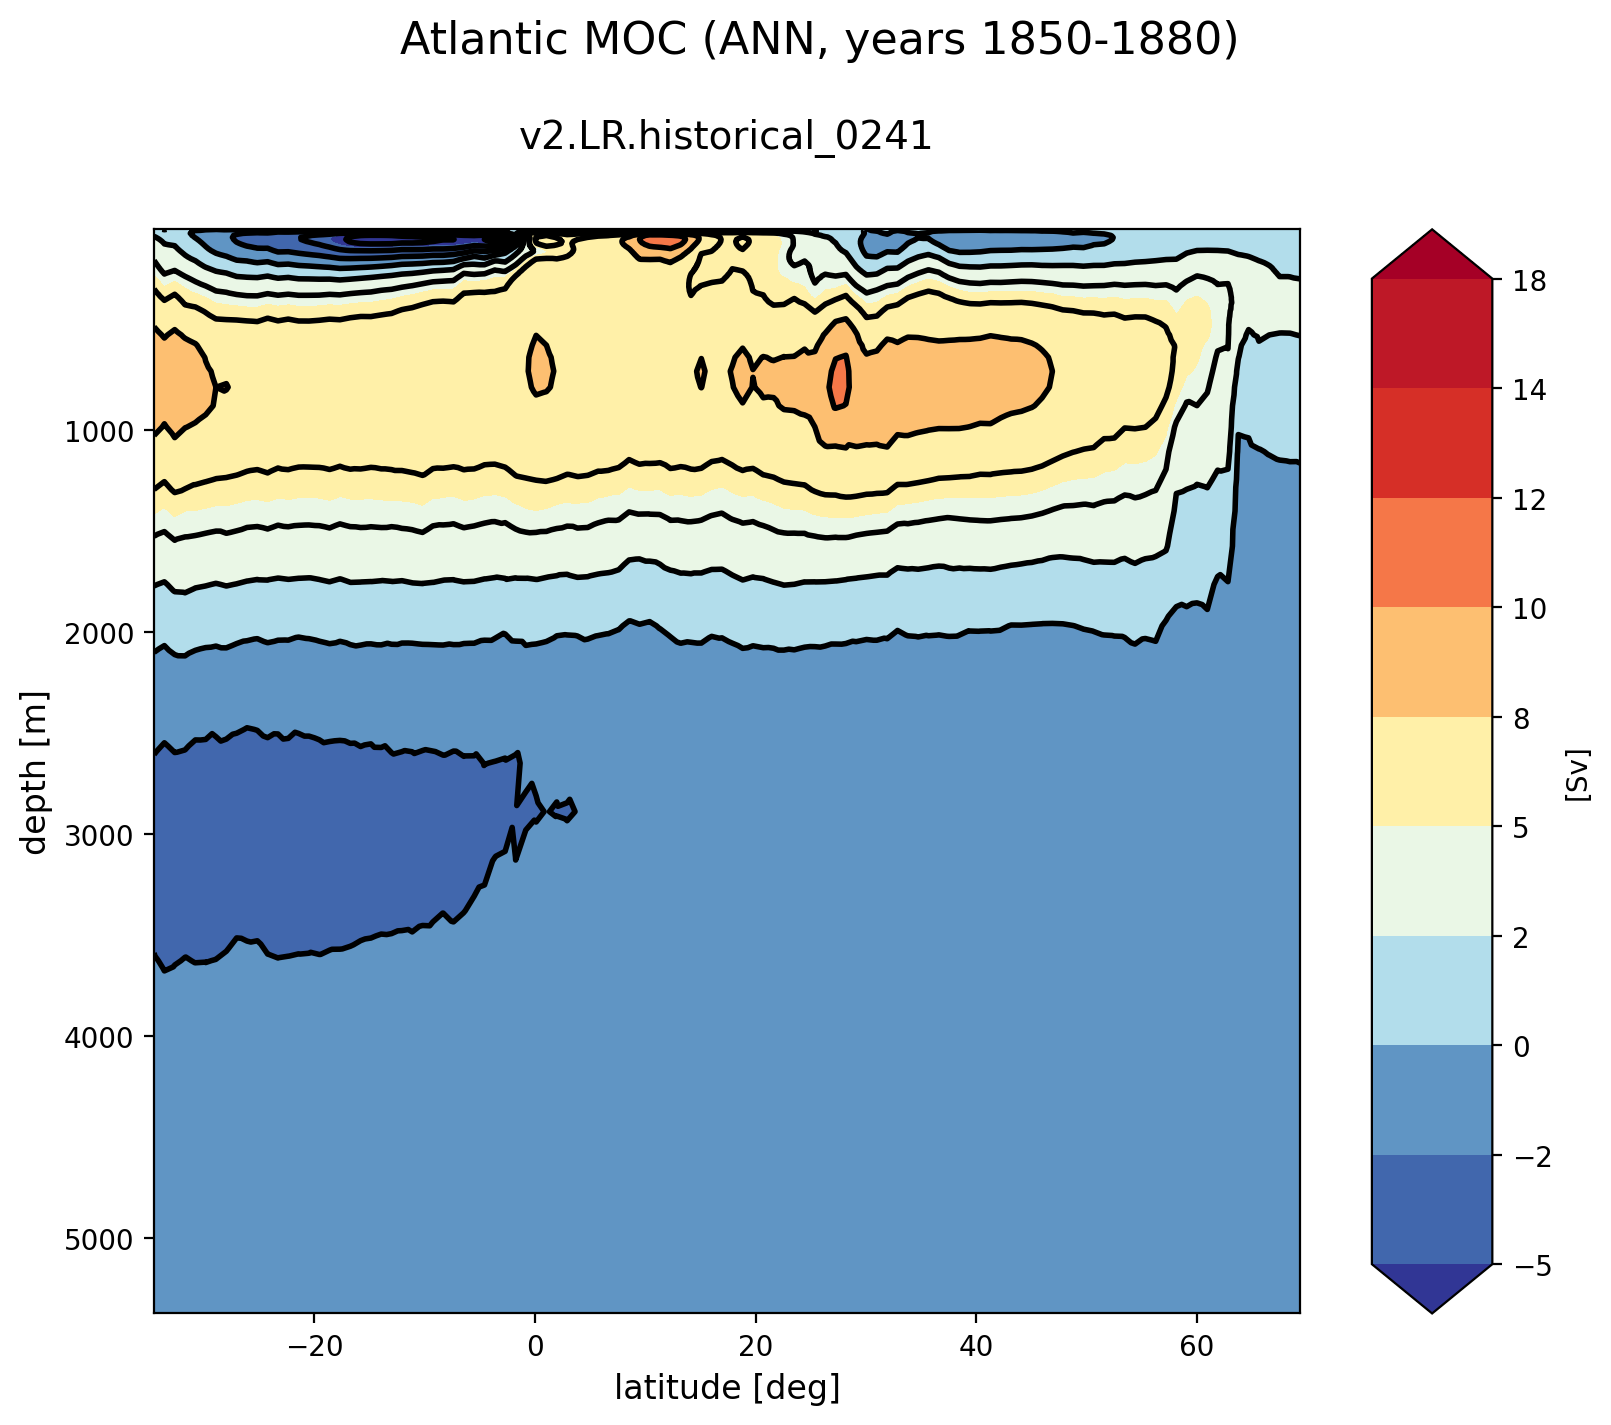
Atlantic
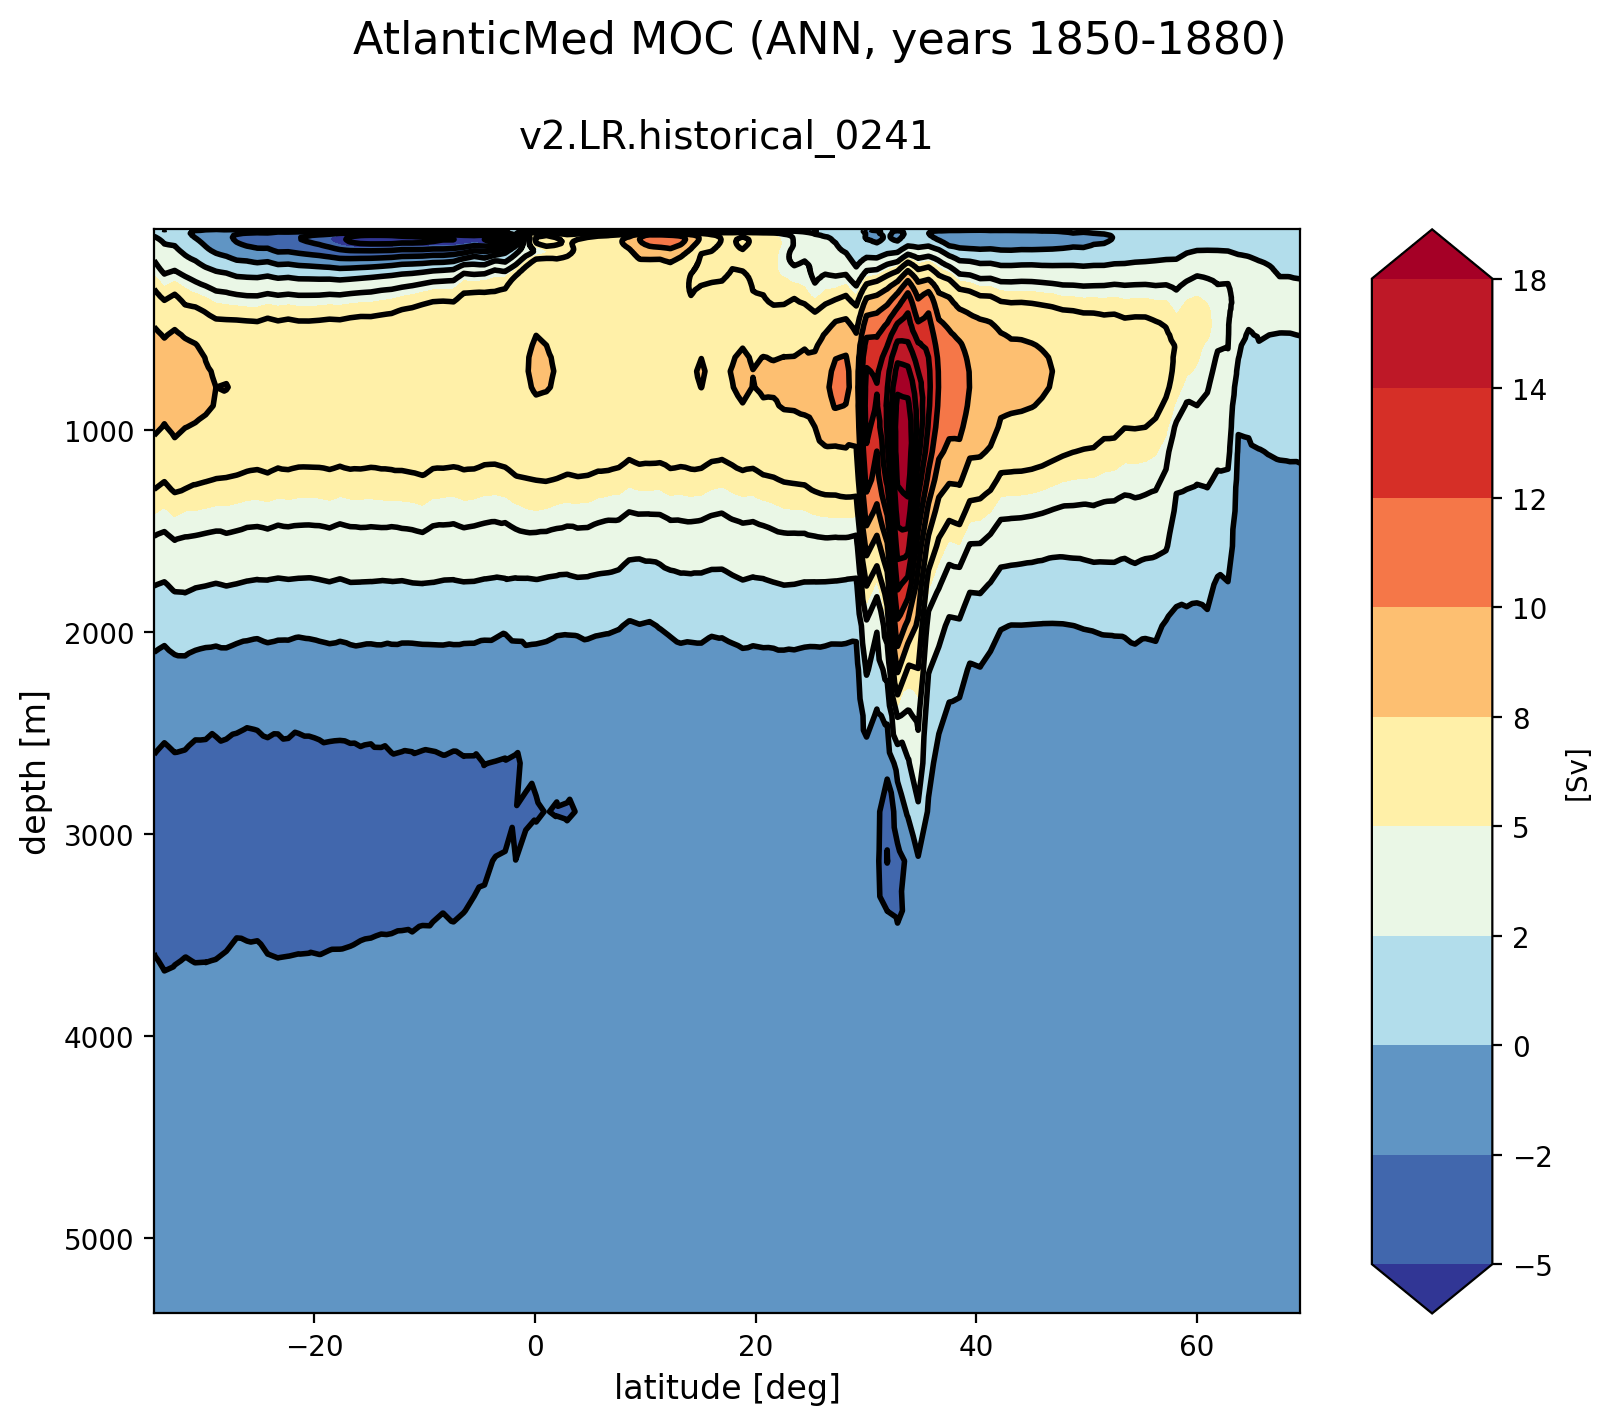
AtlanticMed
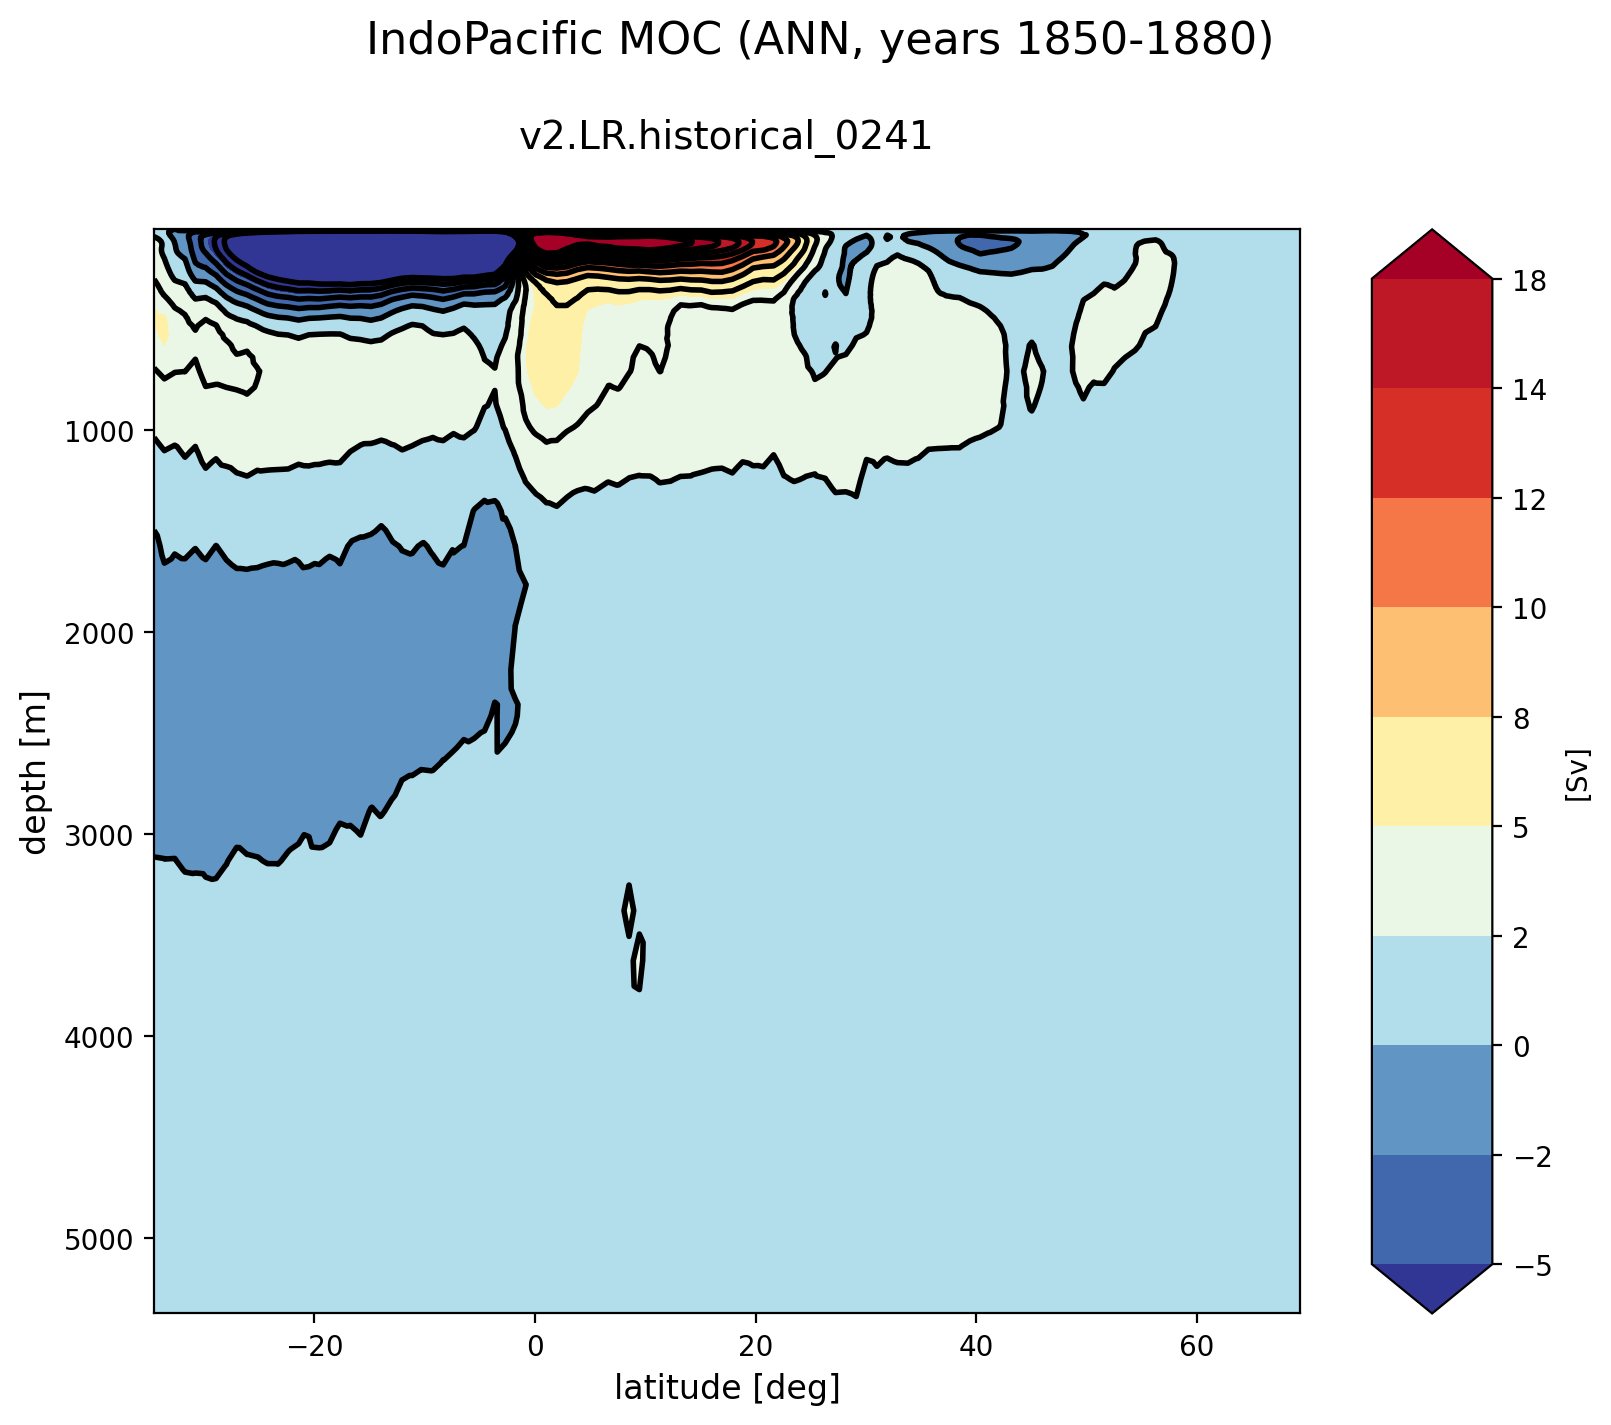
IndoPacific
Time Series
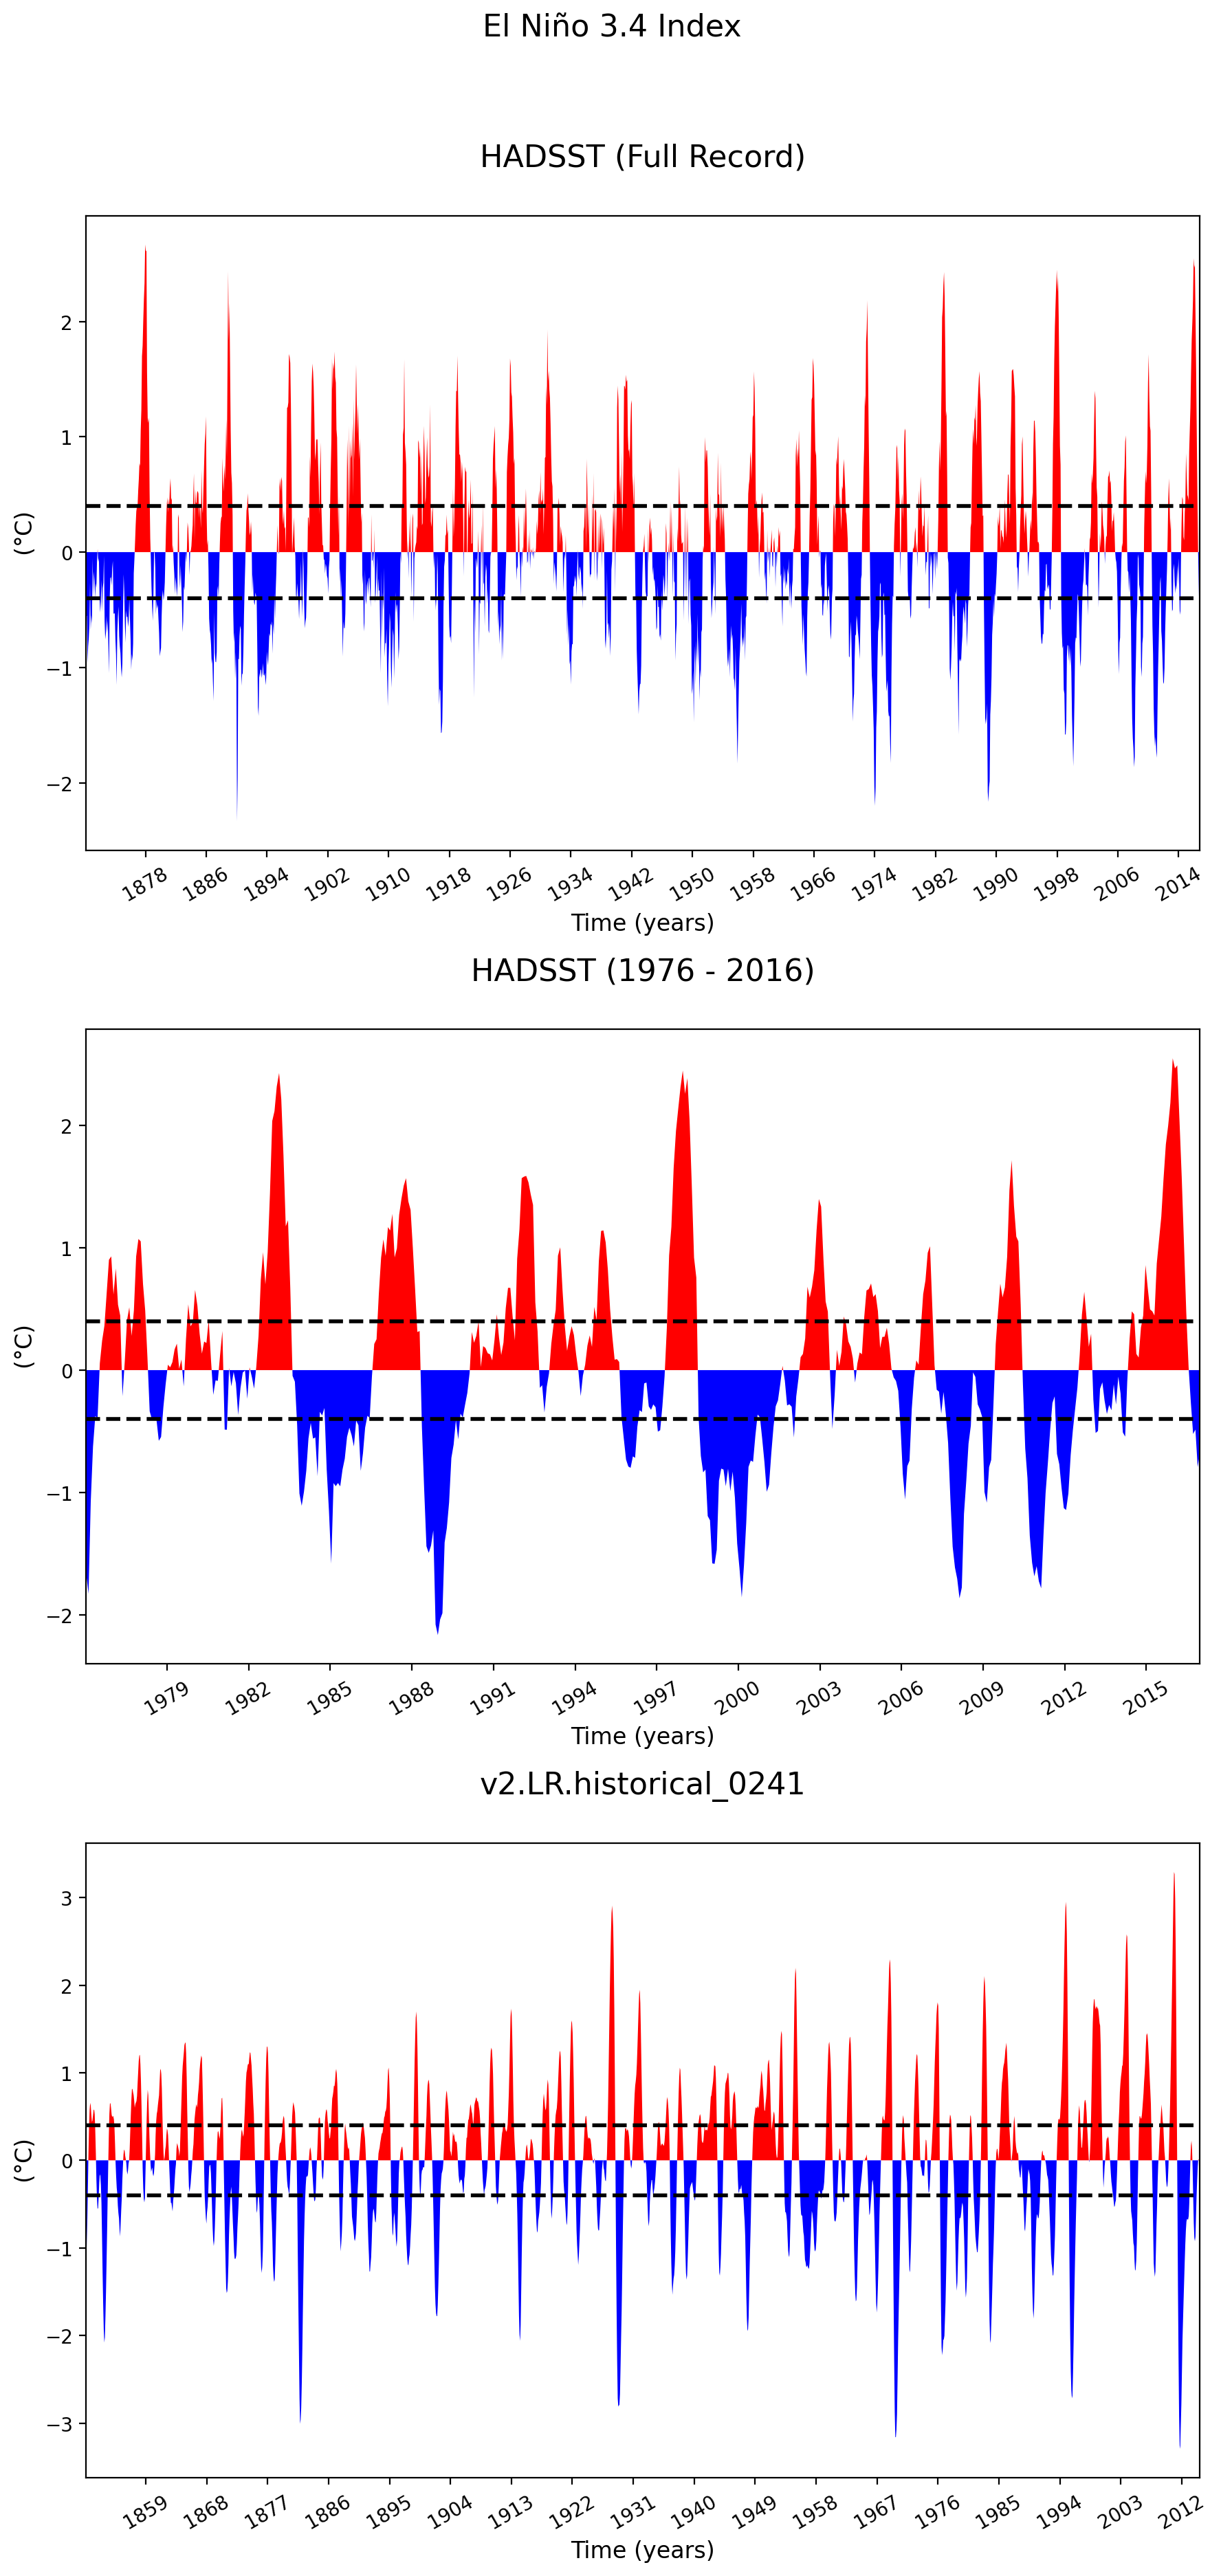
Time Series
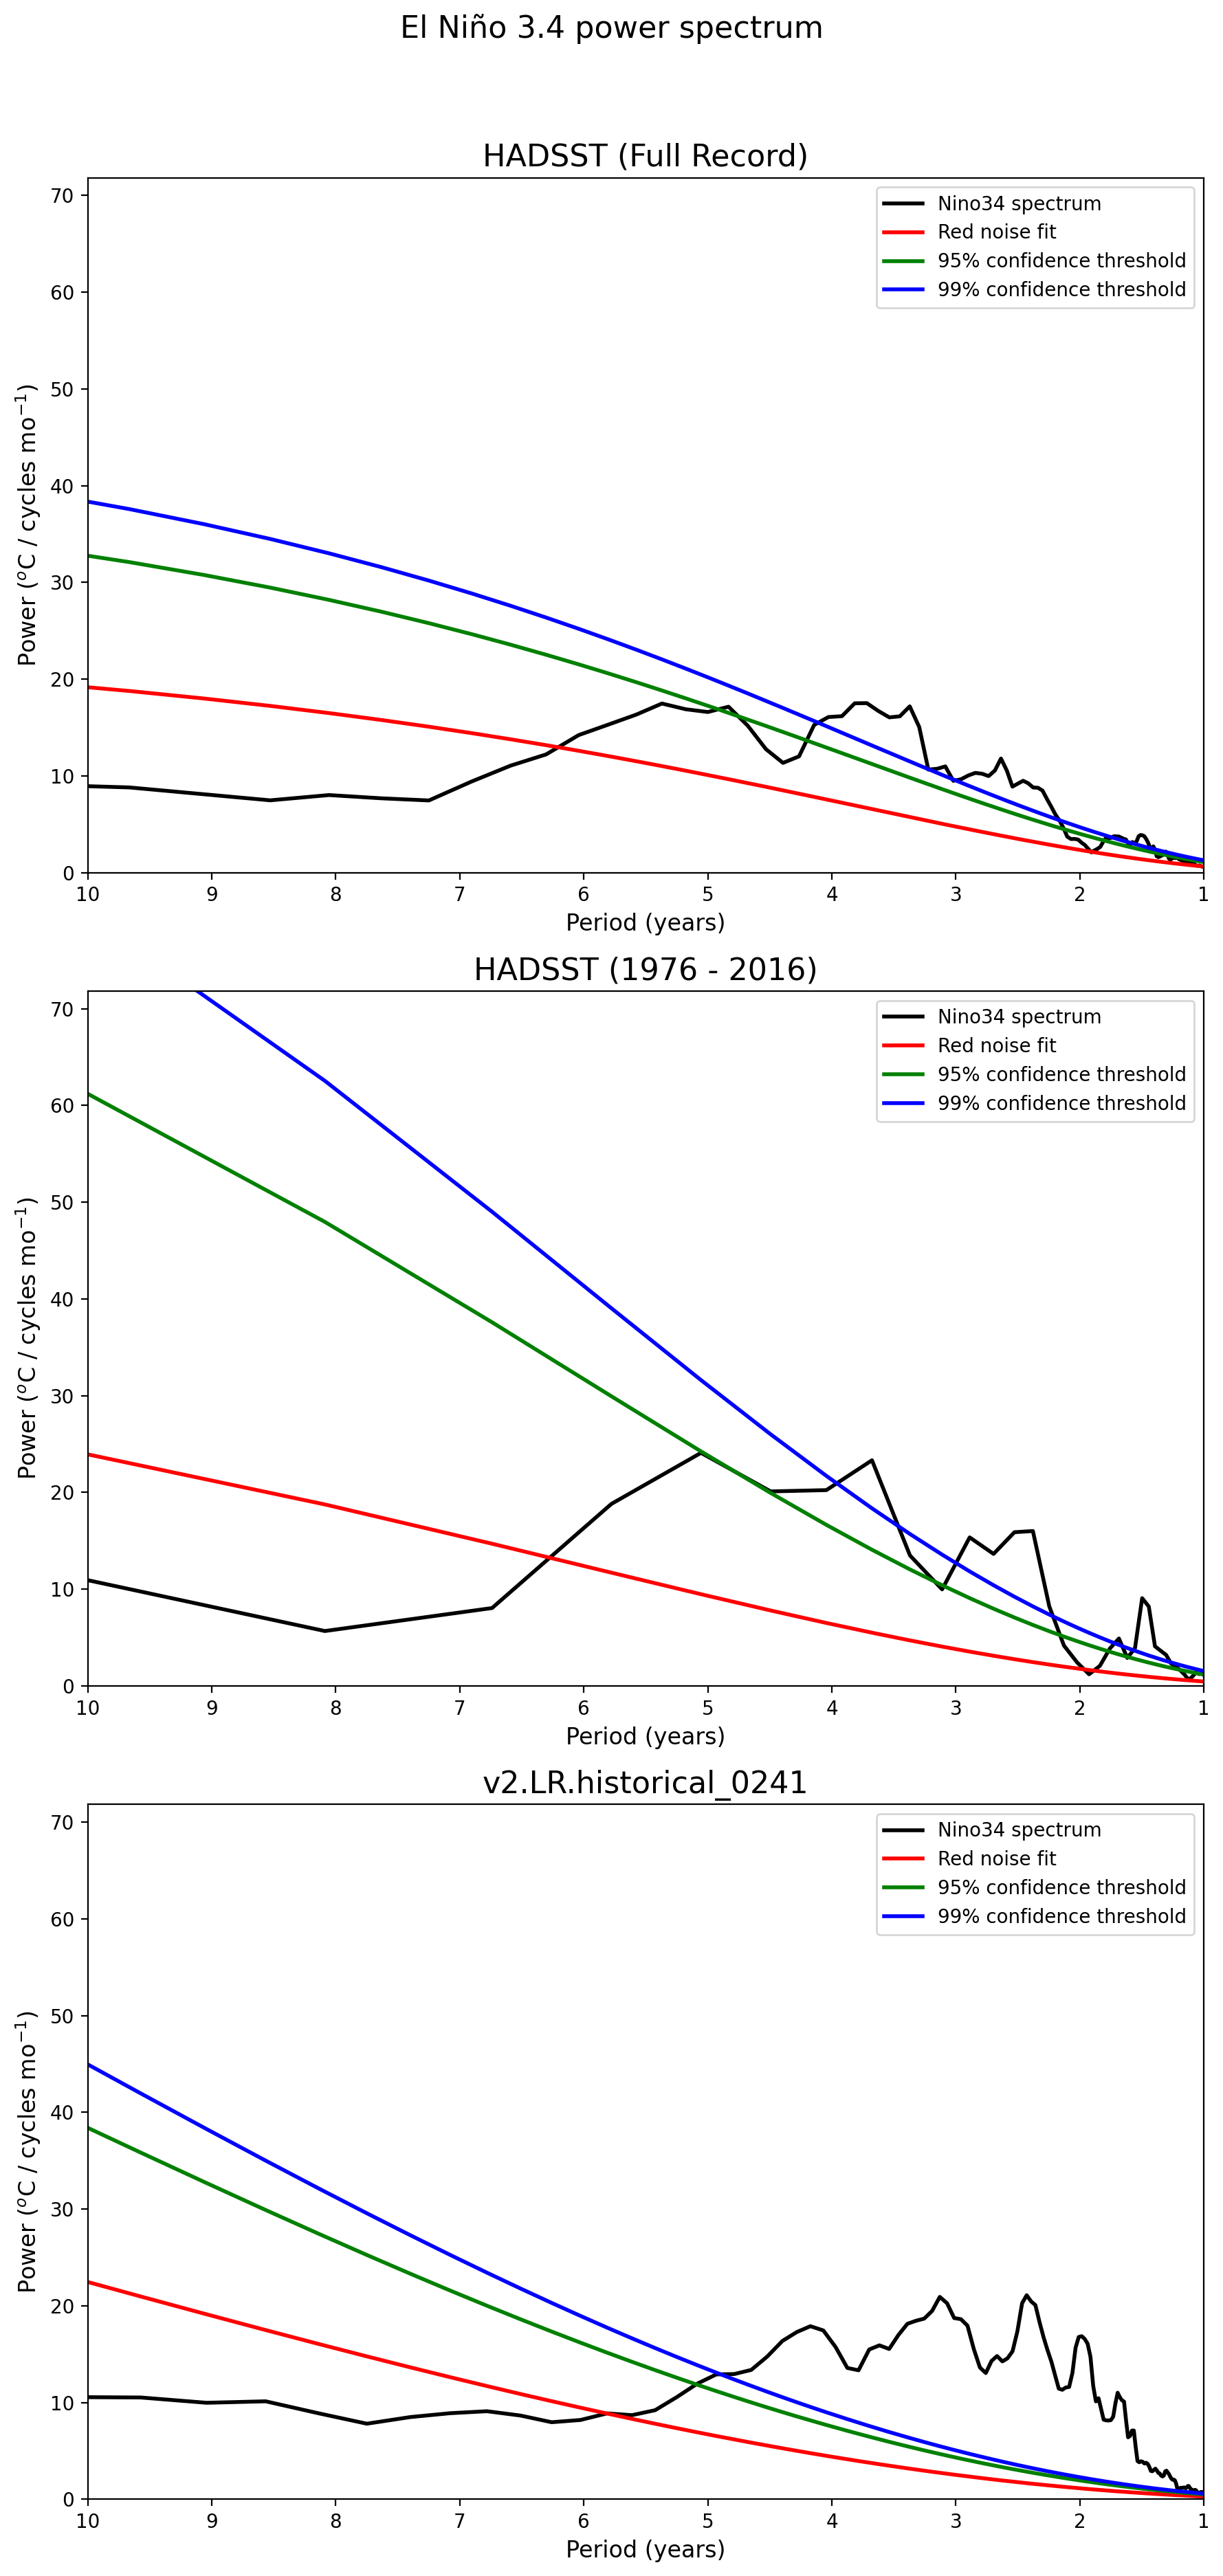
Spectra
Potential Temperature

ANN

JFM

JAS

ANN

JFM

JAS

ANN

JFM

JAS

ANN

JFM

JAS

ANN

JFM

JAS

ANN

JFM

JAS

ANN

JFM

JAS
Salinity

ANN

JFM

JAS

ANN

JFM

JAS

ANN

JFM

JAS

ANN

JFM

JAS

ANN

JFM

JAS

ANN

JFM

JAS

ANN

JFM

JAS
Potential Density

ANN

JFM

JAS

ANN

JFM

JAS

ANN

JFM

JAS

ANN

JFM

JAS

ANN

JFM

JAS

ANN

JFM

JAS

ANN

JFM

JAS
Zonal Velocity

ANN

JFM

JAS

ANN

JFM

JAS

ANN

JFM

JAS

ANN

JFM

JAS

ANN

JFM

JAS

ANN

JFM

JAS

ANN

JFM

JAS
Meridional Velocity

ANN

JFM

JAS

ANN

JFM

JAS

ANN

JFM

JAS

ANN

JFM

JAS

ANN

JFM

JAS

ANN

JFM

JAS

ANN

JFM

JAS
Velocity Magnitude

ANN

JFM

JAS

ANN

JFM

JAS

ANN

JFM

JAS

ANN

JFM

JAS

ANN

JFM

JAS

ANN

JFM

JAS

ANN

JFM

JAS
Potential Temperature

Atlantic Basin JFM

Atlantic Basin JAS

Atlantic Basin ANN

Pacific Basin JFM

Pacific Basin JAS

Pacific Basin ANN

Indian Basin JFM

Indian Basin JAS

Indian Basin ANN

Arctic Basin JFM

Arctic Basin JAS

Arctic Basin ANN

Southern Ocean Basin JFM

Southern Ocean Basin JAS

Southern Ocean Basin ANN

Mediterranean Basin JFM

Mediterranean Basin JAS

Mediterranean Basin ANN

Global Ocean JFM

Global Ocean JAS

Global Ocean ANN

Global Ocean 65N to 65S JFM

Global Ocean 65N to 65S JAS

Global Ocean 65N to 65S ANN

Global Ocean 15S to 15N JFM

Global Ocean 15S to 15N JAS

Global Ocean 15S to 15N ANN
Salinity

Atlantic Basin JFM

Atlantic Basin JAS

Atlantic Basin ANN

Pacific Basin JFM

Pacific Basin JAS

Pacific Basin ANN

Indian Basin JFM

Indian Basin JAS

Indian Basin ANN

Arctic Basin JFM

Arctic Basin JAS

Arctic Basin ANN

Southern Ocean Basin JFM

Southern Ocean Basin JAS

Southern Ocean Basin ANN

Mediterranean Basin JFM

Mediterranean Basin JAS

Mediterranean Basin ANN

Global Ocean JFM

Global Ocean JAS

Global Ocean ANN

Global Ocean 65N to 65S JFM

Global Ocean 65N to 65S JAS

Global Ocean 65N to 65S ANN

Global Ocean 15S to 15N JFM

Global Ocean 15S to 15N JAS

Global Ocean 15S to 15N ANN
Potential Density

Atlantic Basin JFM

Atlantic Basin JAS

Atlantic Basin ANN

Pacific Basin JFM

Pacific Basin JAS

Pacific Basin ANN

Indian Basin JFM

Indian Basin JAS

Indian Basin ANN

Arctic Basin JFM

Arctic Basin JAS

Arctic Basin ANN

Southern Ocean Basin JFM

Southern Ocean Basin JAS

Southern Ocean Basin ANN

Mediterranean Basin JFM

Mediterranean Basin JAS

Mediterranean Basin ANN

Global Ocean JFM

Global Ocean JAS

Global Ocean ANN

Global Ocean 65N to 65S JFM

Global Ocean 65N to 65S JAS

Global Ocean 65N to 65S ANN

Global Ocean 15S to 15N JFM

Global Ocean 15S to 15N JAS

Global Ocean 15S to 15N ANN
Potential Temperature

Atlantic Basin

Pacific Basin

Indian Basin

Arctic Basin

Southern Ocean Basin

Mediterranean Basin

Global Ocean

Global Ocean 65N to 65S

Global Ocean 15S to 15N
Salinity

Atlantic Basin

Pacific Basin

Indian Basin

Arctic Basin

Southern Ocean Basin

Mediterranean Basin

Global Ocean

Global Ocean 65N to 65S

Global Ocean 15S to 15N
Potential Density

Atlantic Basin

Pacific Basin

Indian Basin

Arctic Basin

Southern Ocean Basin

Mediterranean Basin

Global Ocean

Global Ocean 65N to 65S

Global Ocean 15S to 15N