Sea Ice Diagnostics and LENS comparison#
This notebook contains:
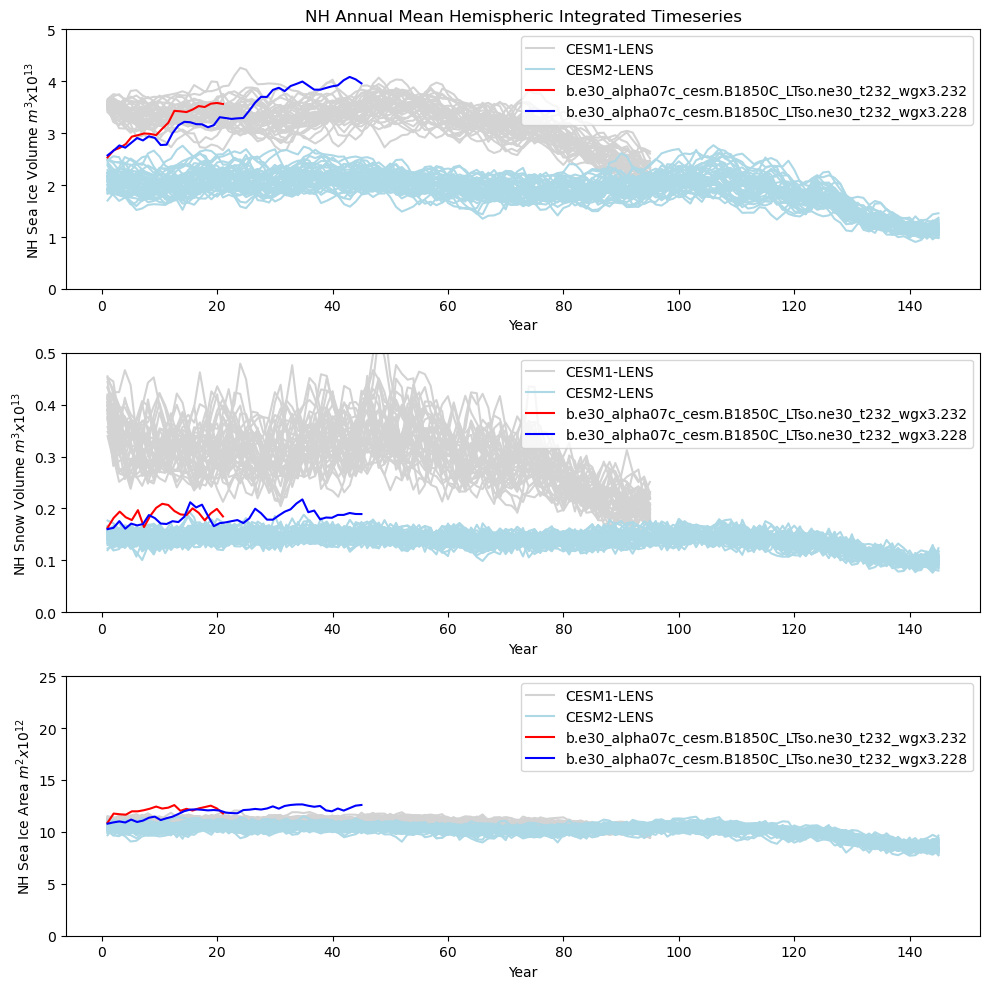
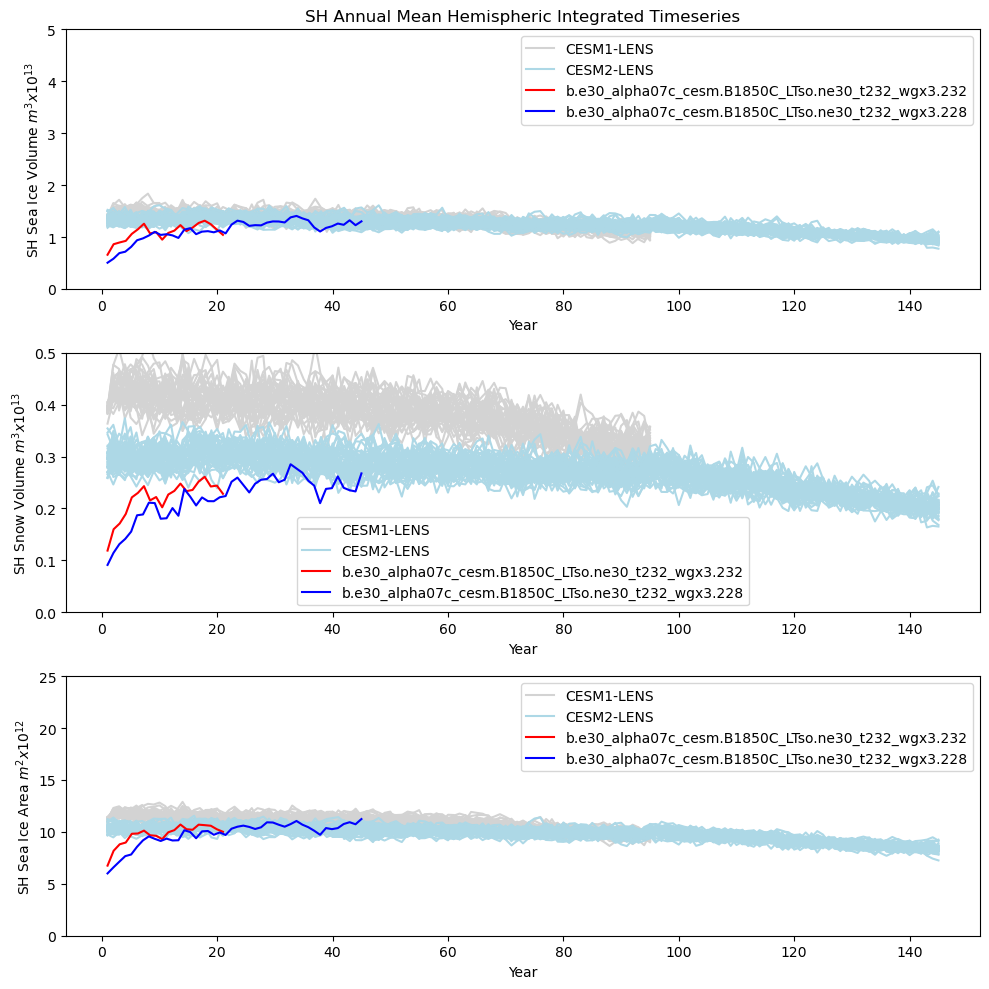
Annual Mean Timeseries plots
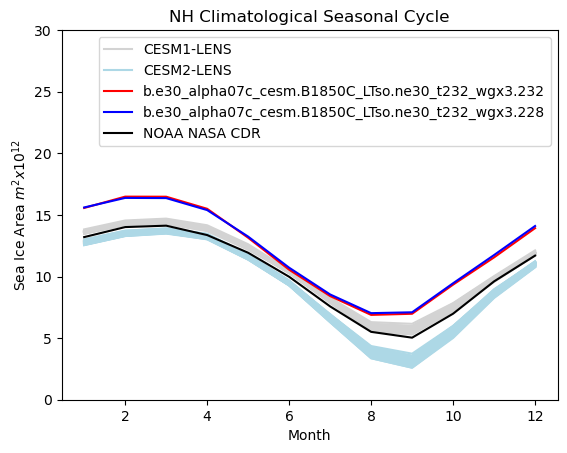
Annual cycle plots of Ice Area, Ice Volume, and Snow Volume
Monthly analysis for min and max months
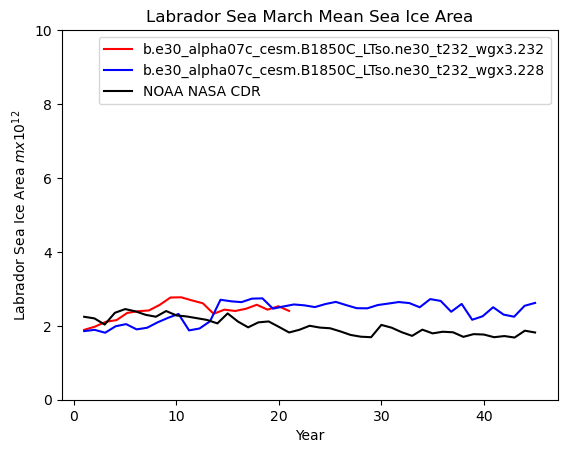
Labrador Sea Timeseries
# Parameters
case_name = "b.e30_alpha07c_cesm.B1850C_LTso.ne30_t232_wgx3.232"
base_case_name = "b.e30_alpha07c_cesm.B1850C_LTso.ne30_t232_wgx3.228"
CESM_output_dir = "/glade/campaign/cesm/development/cross-wg/diagnostic_framework/CESM_output_for_testing"
start_date = "0001-01-01"
end_date = "0021-01-01"
base_start_date = "0001-01-01"
base_end_date = "0045-01-01"
obs_data_dir = (
    "/glade/campaign/cesm/development/cross-wg/diagnostic_framework/CUPiD_obs_data"
)
ts_dir = None
lc_kwargs = {"threads_per_worker": 1}
serial = False
climo_nyears = 35
grid_file = "/glade/campaign/cesm/community/omwg/grids/tx2_3v2_grid.nc"
path_model = "/glade/campaign/cesm/development/cross-wg/diagnostic_framework/CUPiD_model_data/ice/"
subset_kwargs = {}
product = "/glade/work/richling/CUPid_pr_test/CUPiD/examples/key_metrics/computed_notebooks//ice/Hemis_seaice_visual_compare_obs_lens.ipynb"
Client
Client-d2de55dd-b44a-11f0-9966-10ffe0a13777
| Connection method: Cluster object | Cluster type: distributed.LocalCluster |
| Dashboard: http://127.0.0.1:8787/status |
Cluster Info
LocalCluster
60c1d935
| Dashboard: http://127.0.0.1:8787/status | Workers: 4 |
| Total threads: 4 | Total memory: 64.00 GiB |
| Status: running | Using processes: True |
Scheduler Info
Scheduler
Scheduler-4a3a5982-de0d-4401-8cf4-b6a27376e59d
| Comm: tcp://127.0.0.1:34705 | Workers: 0 |
| Dashboard: http://127.0.0.1:8787/status | Total threads: 0 |
| Started: Just now | Total memory: 0 B |
Workers
Worker: 0
| Comm: tcp://127.0.0.1:35983 | Total threads: 1 |
| Dashboard: http://127.0.0.1:37217/status | Memory: 16.00 GiB |
| Nanny: tcp://127.0.0.1:33789 | |
| Local directory: /glade/derecho/scratch/richling/tmp/dask-scratch-space/worker-gay69je3 | |
Worker: 1
| Comm: tcp://127.0.0.1:40145 | Total threads: 1 |
| Dashboard: http://127.0.0.1:39709/status | Memory: 16.00 GiB |
| Nanny: tcp://127.0.0.1:32909 | |
| Local directory: /glade/derecho/scratch/richling/tmp/dask-scratch-space/worker-x7vhi_ti | |
Worker: 2
| Comm: tcp://127.0.0.1:37887 | Total threads: 1 |
| Dashboard: http://127.0.0.1:34179/status | Memory: 16.00 GiB |
| Nanny: tcp://127.0.0.1:45373 | |
| Local directory: /glade/derecho/scratch/richling/tmp/dask-scratch-space/worker-y484z5r4 | |
Worker: 3
| Comm: tcp://127.0.0.1:39181 | Total threads: 1 |
| Dashboard: http://127.0.0.1:45345/status | Memory: 16.00 GiB |
| Nanny: tcp://127.0.0.1:33345 | |
| Local directory: /glade/derecho/scratch/richling/tmp/dask-scratch-space/worker-a4spl59i | |
Read in data#
New CESM cases to compare#
Define Functions#
Read in CESM LENS Data#
Annual Mean Timeseries plots#
<matplotlib.legend.Legend at 0x148c118db4d0>
<matplotlib.legend.Legend at 0x148c116ab510>
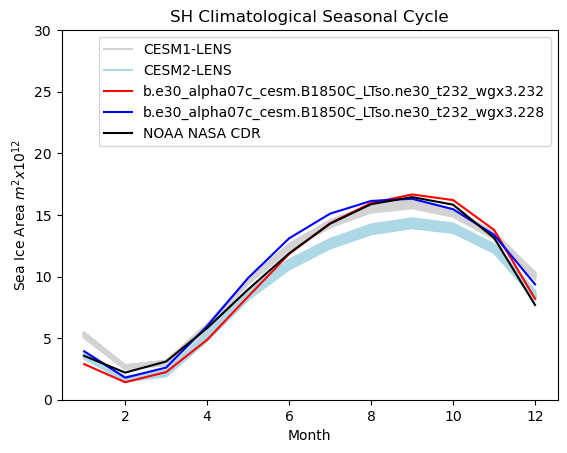
Annual cycle plots - Ice Area#
<matplotlib.legend.Legend at 0x148c11ffb290>
<matplotlib.legend.Legend at 0x148c104e1b90>
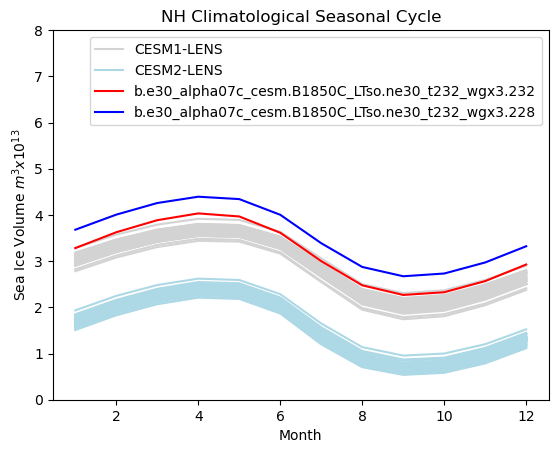
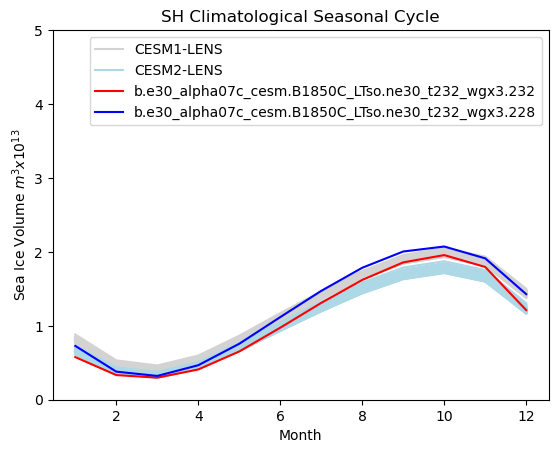
Annual cycle plots - Ice Volume#
<matplotlib.legend.Legend at 0x148c108bcb90>
<matplotlib.legend.Legend at 0x148c023aa890>
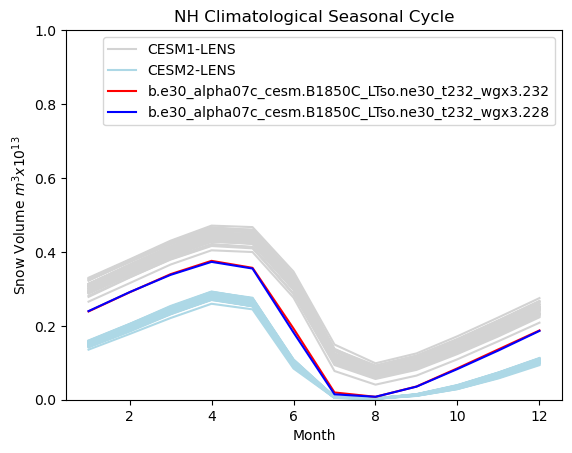
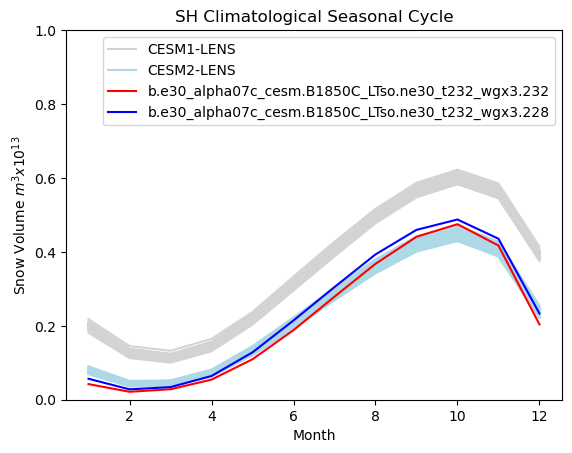
Annual cycle plots - Snow volume#
<matplotlib.legend.Legend at 0x148c12020210>
<matplotlib.legend.Legend at 0x148c0393a650>
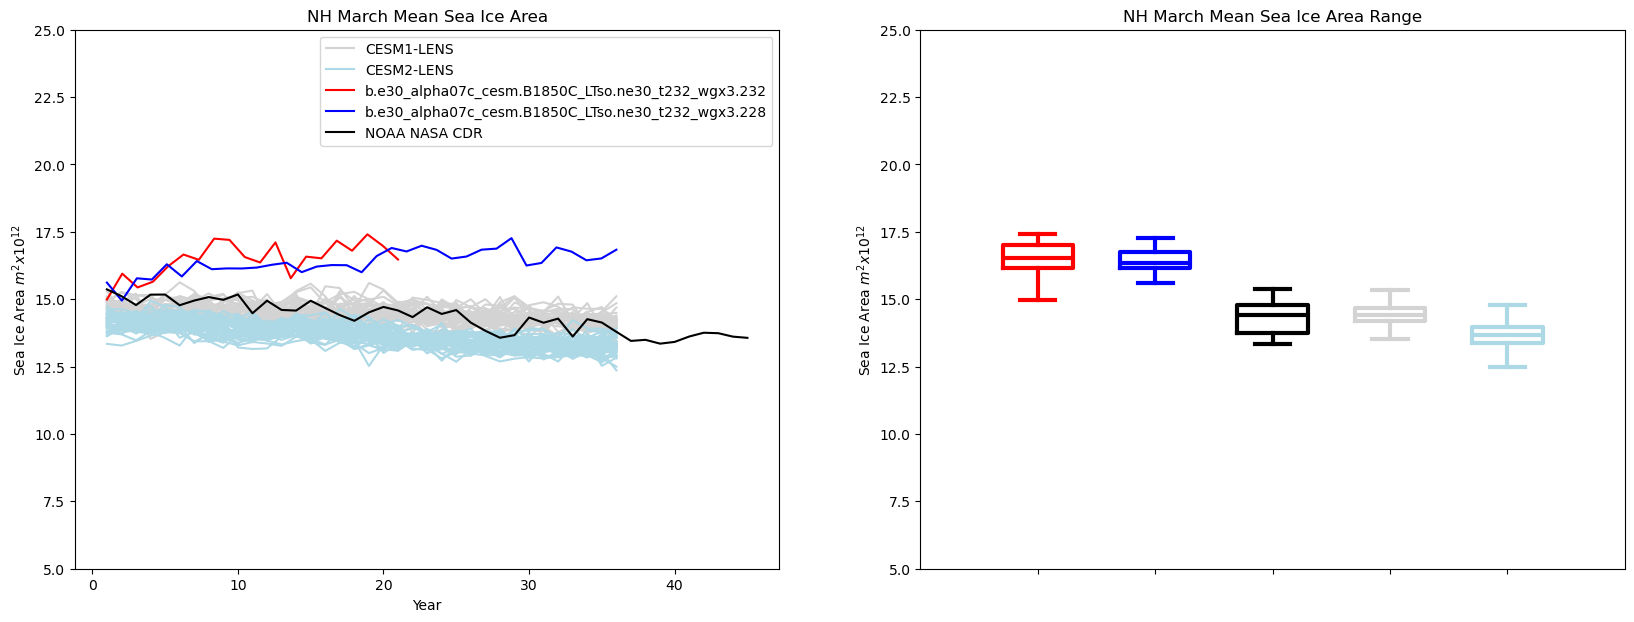
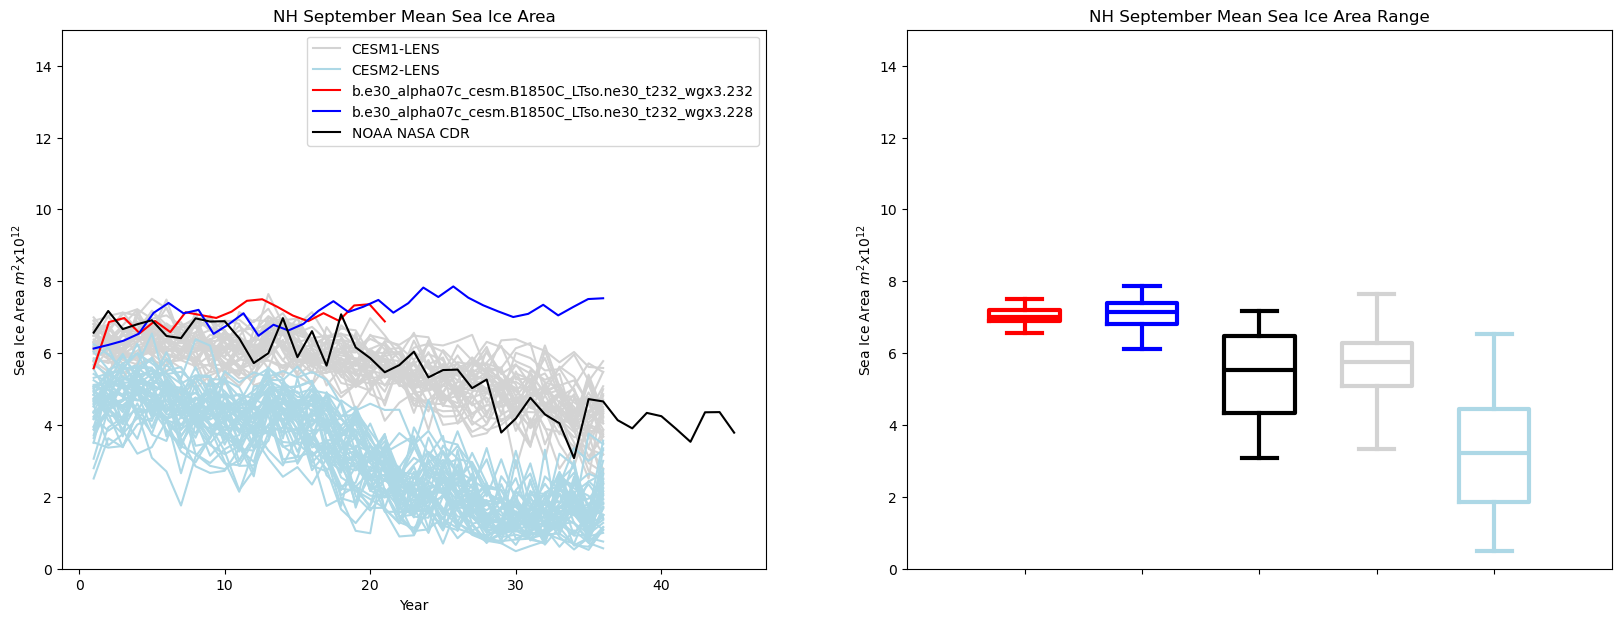
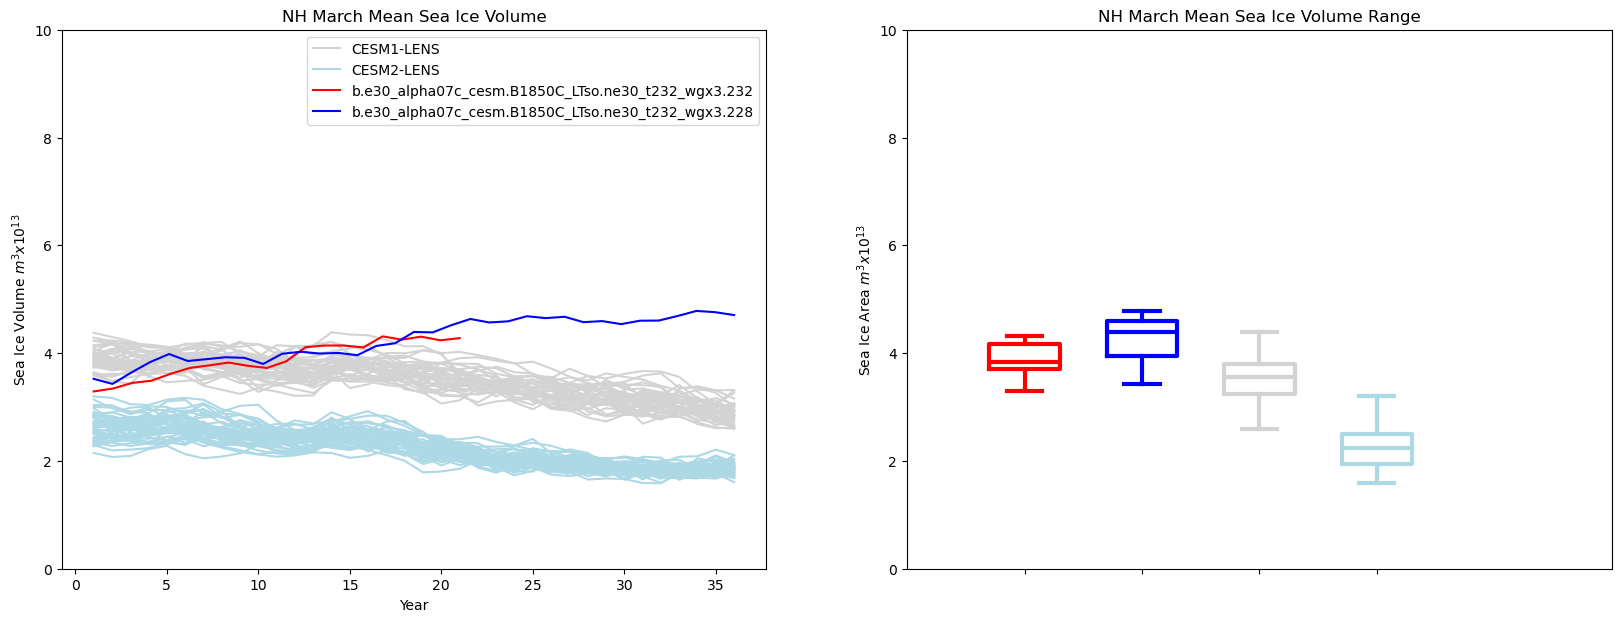
Monthly Analysis for Minimum and Maximum Months#
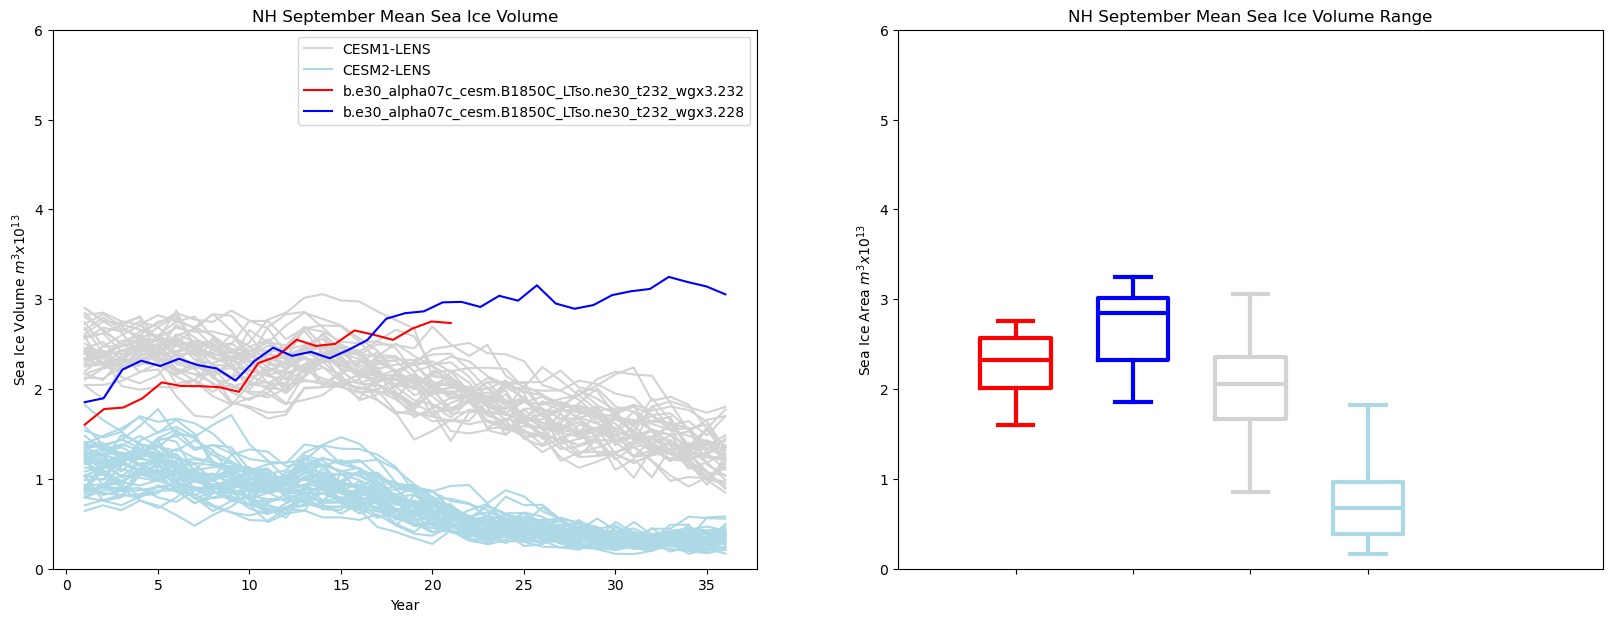
NH#
Maximum - March
Minimum - September
Ice Area#
(array([0.25, 0.5 , 0.75, 1.  , 1.25]),
 [Text(0.25, 0, '0.25'),
  Text(0.5, 0, '0.5'),
  Text(0.75, 0, '0.75'),
  Text(1.0, 0, '1.0'),
  Text(1.25, 0, '1.25')])
(array([0.25, 0.5 , 0.75, 1.  , 1.25]),
 [Text(0.25, 0, '0.25'),
  Text(0.5, 0, '0.5'),
  Text(0.75, 0, '0.75'),
  Text(1.0, 0, '1.0'),
  Text(1.25, 0, '1.25')])
Ice Volume#
(array([0.25, 0.5 , 0.75, 1.  ]),
 [Text(0.25, 0, '0.25'),
  Text(0.5, 0, '0.5'),
  Text(0.75, 0, '0.75'),
  Text(1.0, 0, '1.0')])
(array([0.25, 0.5 , 0.75, 1.  ]),
 [Text(0.25, 0, '0.25'),
  Text(0.5, 0, '0.5'),
  Text(0.75, 0, '0.75'),
  Text(1.0, 0, '1.0')])
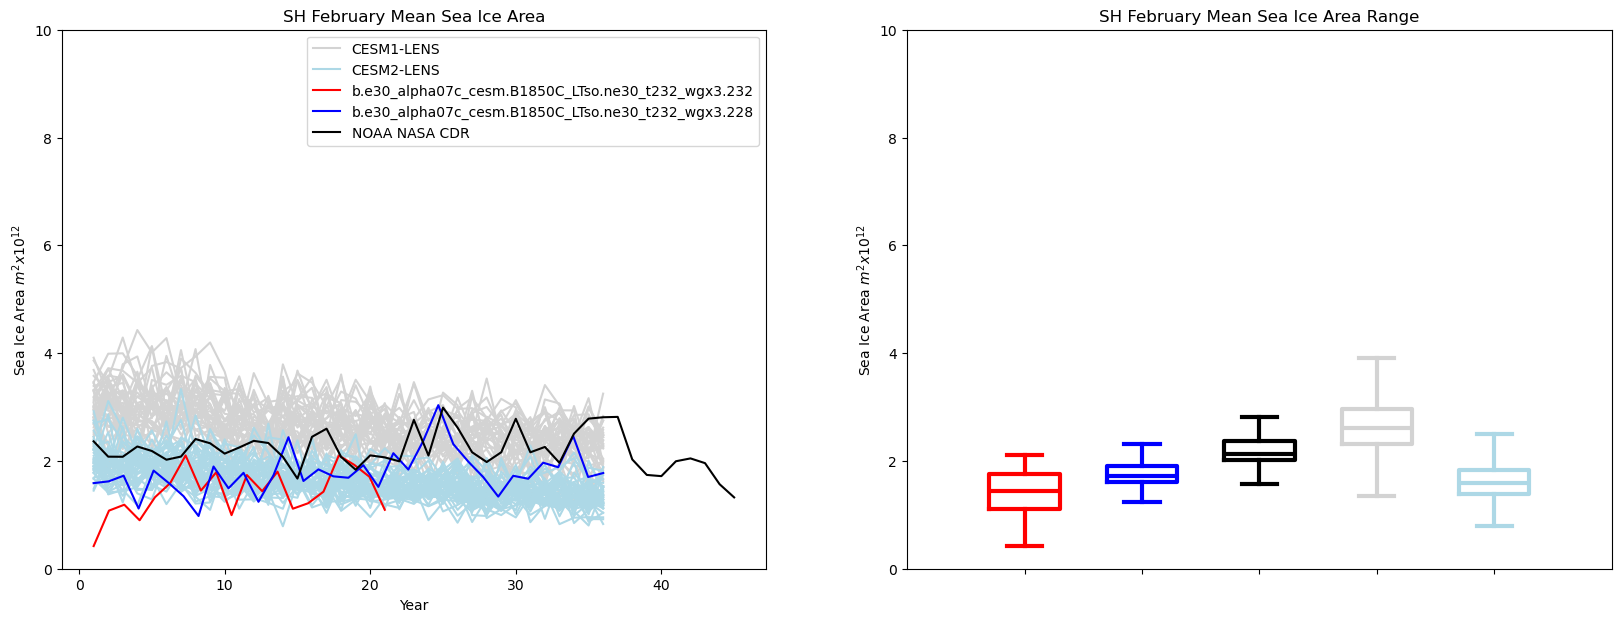
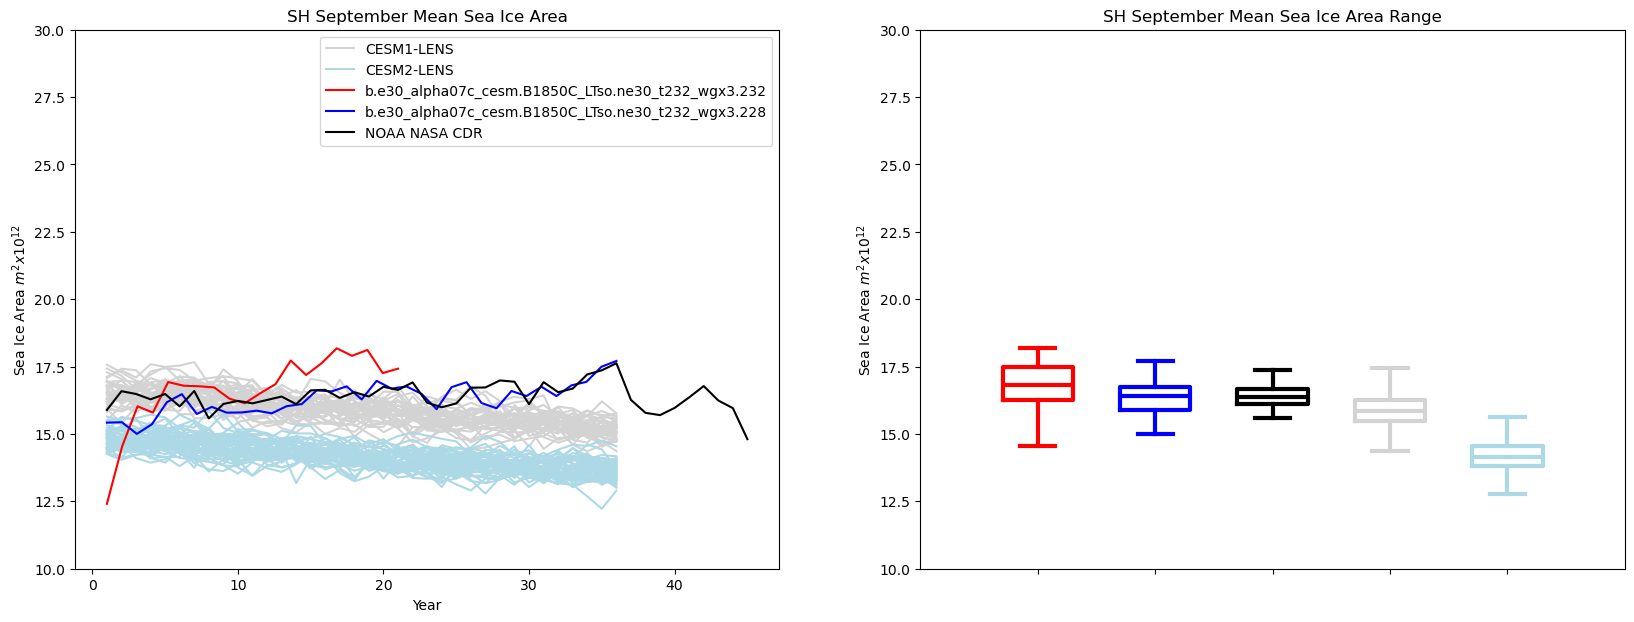
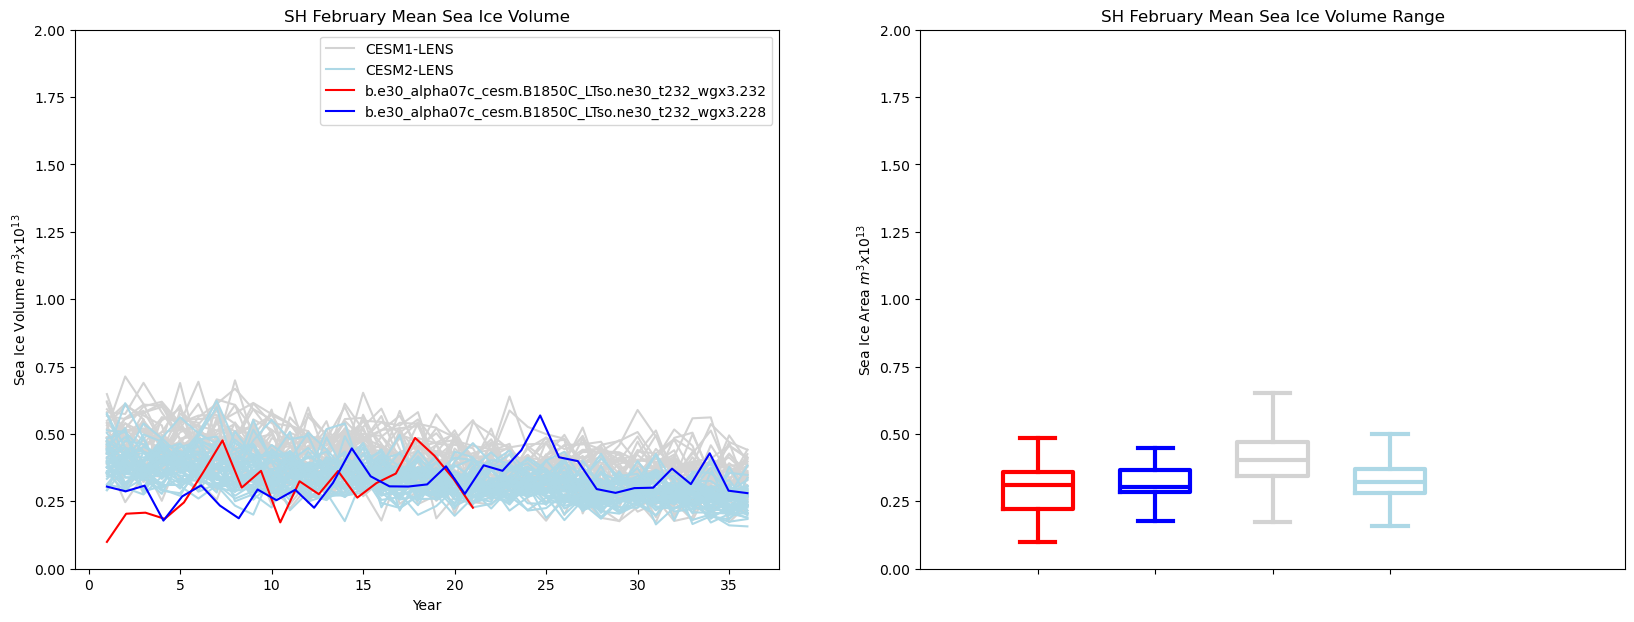
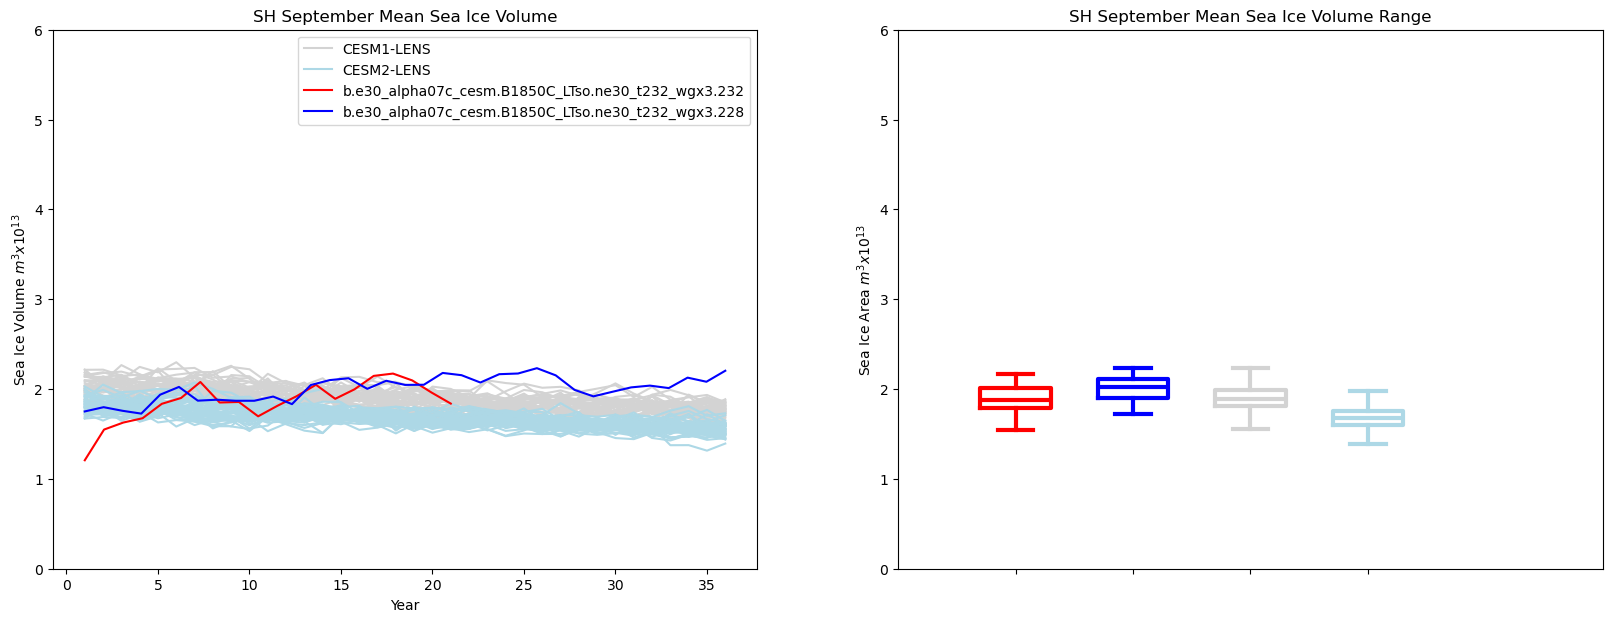
SH#
Maximum - September
Minimum - February
Ice Area#
(array([0.25, 0.5 , 0.75, 1.  , 1.25]),
 [Text(0.25, 0, '0.25'),
  Text(0.5, 0, '0.5'),
  Text(0.75, 0, '0.75'),
  Text(1.0, 0, '1.0'),
  Text(1.25, 0, '1.25')])
(array([0.25, 0.5 , 0.75, 1.  , 1.25]),
 [Text(0.25, 0, '0.25'),
  Text(0.5, 0, '0.5'),
  Text(0.75, 0, '0.75'),
  Text(1.0, 0, '1.0'),
  Text(1.25, 0, '1.25')])
Ice Volume#
(array([0.25, 0.5 , 0.75, 1.  ]),
 [Text(0.25, 0, '0.25'),
  Text(0.5, 0, '0.5'),
  Text(0.75, 0, '0.75'),
  Text(1.0, 0, '1.0')])
(array([0.25, 0.5 , 0.75, 1.  ]),
 [Text(0.25, 0, '0.25'),
  Text(0.5, 0, '0.5'),
  Text(0.75, 0, '0.75'),
  Text(1.0, 0, '1.0')])
Labrador Sea Timeseries#
<matplotlib.legend.Legend at 0x148c0275cc10>