The control reaches a median monthly NSE of 0.106 across 2,257 gauges. Hillslope hydrology raises it to 0.219 and prognostic phenology lowers it to 0.067; irrigation and evolving land cover change it by less than 0.01.
Control baseline
Best and worst regions (HUC02): best in 06 (Tennessee), 11 (Arkansas-White-Red), 05 (Ohio) and 03 (South Atlantic-Gulf); worst in 15 (Lower Colorado), 13 (Rio Grande) and 16 (Great Basin), with the Missouri (10) also poor.
Best gauge: North Fork Alsea River at Alsea, OR (NSE 0.941).
Missouri over-prediction: at the five naturalized mainstem gauges, bias grows upstream from +63% at Hermann, MO to +98% at Fort Benton, MT, and NSE falls from −0.39 to −8.40. The Ohio and Mississippi test gauges score NSE 0.30-0.54.
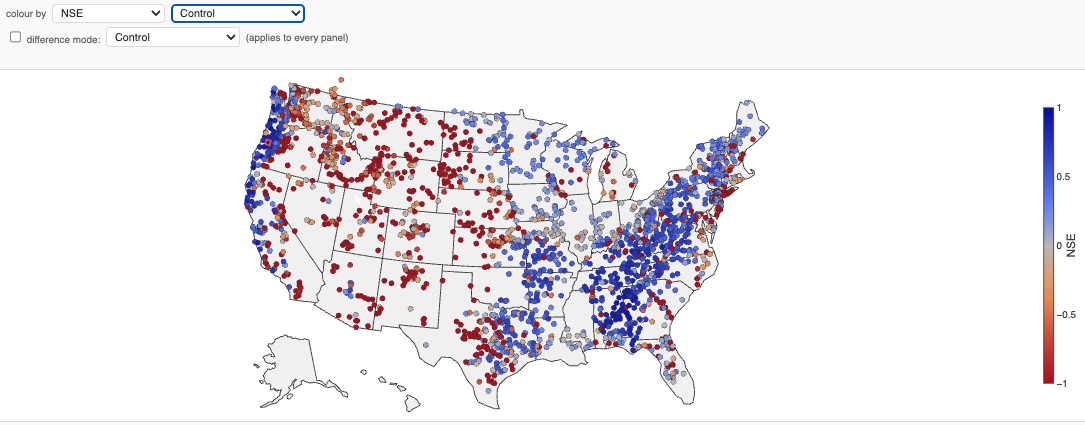
Monthly NSE at each gauge, control.
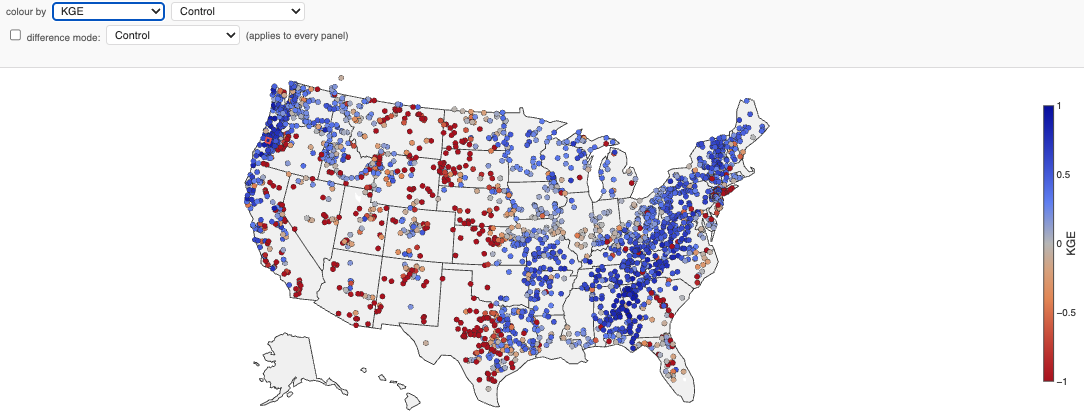
Monthly KGE at each gauge, control.
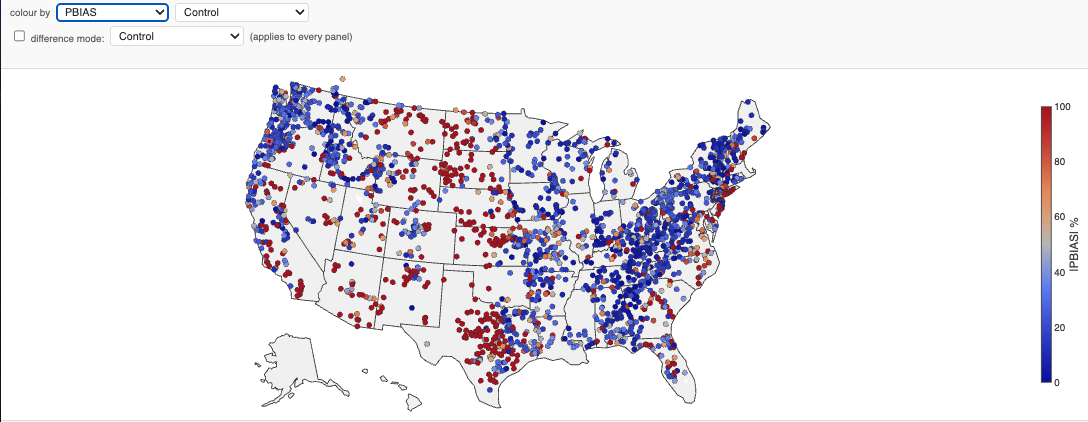
abs(PBIAS) at each gauge, control (dashboard; scale 0 to 100%). The map shows the size of the bias, not its sign.
Configuration sensitivities
Hillslope hydrology is the only option that improves streamflow skill substantially: median monthly NSE rises from 0.106 to 0.219 and KGE from 0.251 to 0.348. Prognostic phenology lowers skill on all three metrics, and irrigation and evolving land cover change it by amounts mostly within the materiality threshold.
Each contrast changes one option against the right baseline (spinup history also differs by configuration; see Lessons, caveats and future work):
| Contrast | Compared runs | Option tested |
|---|---|---|
| Irrigation | irrigation_on − control | irrigation on |
| Land cover | evolving_landcover − irrigation_on | evolving land cover, irrigation held on |
| Hillslope | hillslope_eval − control | hillslope hydrology |
| Phenology | prog_phenology − control | prognostic (BGC) vs satellite phenology |
Medians use 2,257 gauges (2,256 for KGE and correlation: the Swan River at East Patchogue, NY has zero simulated flow, so KGE is undefined there).
Summary across gauges
| Configuration | Median NSE | Median NSE, ≥ 60 months (n = 2,128) | Median KGE | Median PBIAS | Median abs(PBIAS) | Median correlation |
|---|---|---|---|---|---|---|
| control | 0.106 | 0.109 | 0.251 | +13.2% | 28.1% | 0.642 |
| irrigation_on | 0.106 | 0.109 | 0.249 | +15.0% | 28.2% | 0.643 |
| evolving_landcover | 0.097 | 0.099 | 0.253 | +13.7% | 28.1% | 0.639 |
| hillslope_eval | 0.219 | 0.222 | 0.348 | −17.5% | 32.2% | 0.712 |
| prog_phenology | 0.067 | 0.076 | 0.215 | +30.7% | 40.5% | 0.680 |
Gauges improved vs baseline (better / worse; the rest unchanged)
| Contrast | NSE, strict | NSE, material | KGE, strict | KGE, material | abs(PBIAS), strict | abs(PBIAS), material |
|---|---|---|---|---|---|---|
| Irrigation vs control | 942 / 1,312 | 222 / 574 | 1,056 / 1,200 | 188 / 441 | 1,024 / 1,230 | 272 / 527 |
| Land cover vs irrigation_on | 1,238 / 1,016 | 547 / 414 | 1,257 / 999 | 379 / 300 | 1,107 / 1,147 | 445 / 394 |
| Hillslope vs control | 1,352 / 902 | 1,309 / 859 | 1,412 / 844 | 1,365 / 776 | 1,068 / 1,186 | 1,049 / 1,156 |
| Prog. phenology vs control | 924 / 1,330 | 835 / 1,235 | 858 / 1,398 | 756 / 1,310 | 665 / 1,589 | 601 / 1,513 |
Irrigation. Irrigation leaves the median NSE at 0.106 and raises the median PBIAS from +13.2% to +15.0%. 796 of 2,257 gauges change materially, and losses outnumber gains (222 better, 574 worse in NSE). The losses concentrate in the Missouri (28 / 135), the Pacific Northwest (27 / 147), Texas-Gulf (6 / 55) and California (10 / 49); the Missouri median PBIAS rises from +86% to +96%.
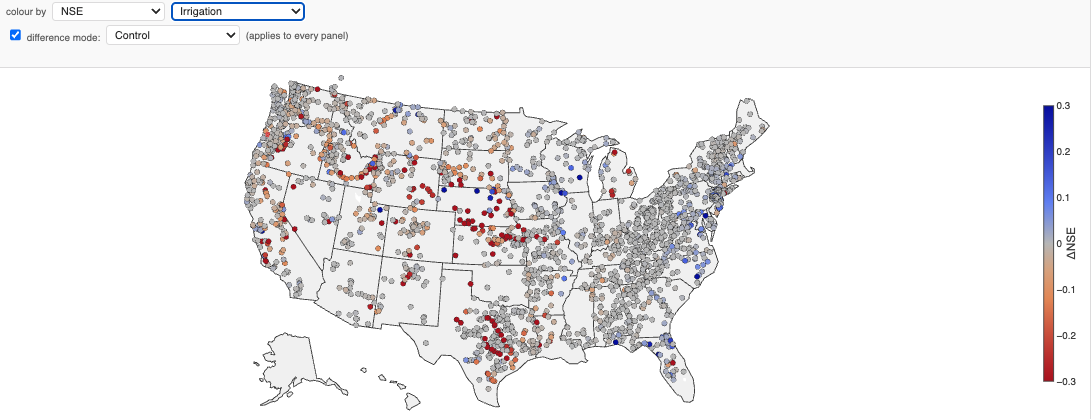
Change in monthly NSE at each gauge, irrigation_on − control. Blue is better; colours are clipped at ±0.3.
Land cover. Against irrigation_on, evolving land cover lowers the median NSE from 0.106 to 0.097 even though more gauges improve than degrade (547 better, 414 worse in NSE). Gains are in the Pacific Northwest (169 / 19), California (50 / 15) and the Great Basin (26 / 9). Losses are in the Missouri (80 / 93), the Mid-Atlantic (33 / 54), South Atlantic-Gulf (25 / 38) and Souris-Red-Rainy, where the median NSE falls from 0.208 to −0.041.
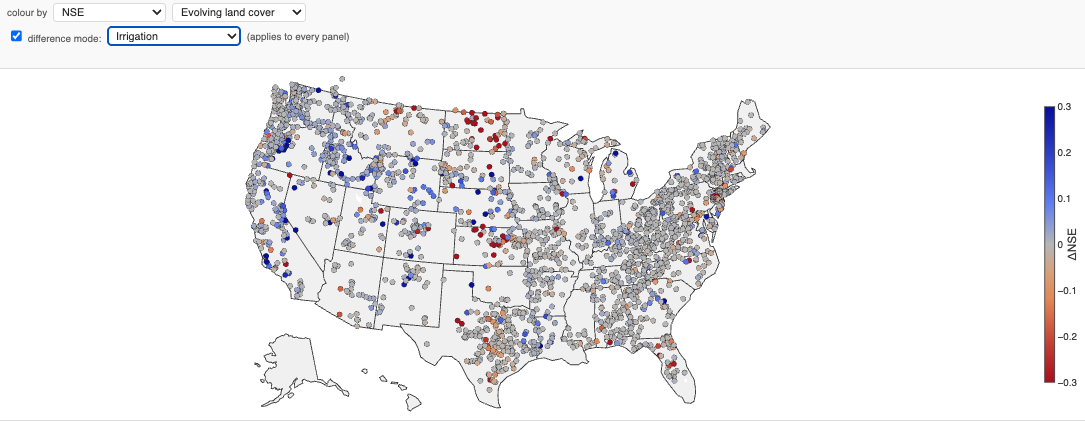
Change in monthly NSE at each gauge, evolving_landcover − irrigation_on. Blue is better; colours are clipped at ±0.3.
Hillslope hydrology. Hillslope roughly doubles the median NSE (0.106 to 0.219) and raises median KGE from 0.251 to 0.348 and median correlation from 0.642 to 0.712. NSE is materially better at 1,309 gauges and worse at 859.
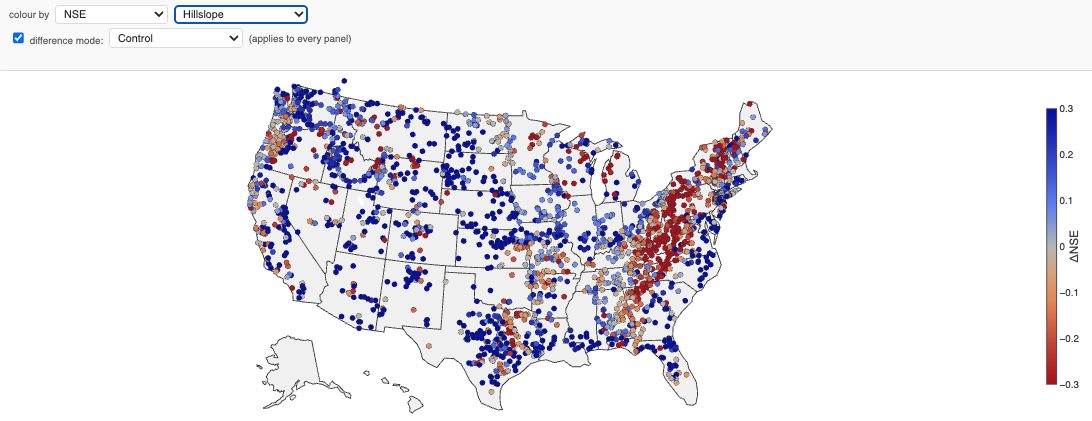
Change in monthly NSE at each gauge, hillslope_eval − control. Blue is better; colours are clipped at ±0.3.
Median PBIAS is lower in every HUC02 region. The median PBIAS flips from +13.2% to −17.5%. The median abs(PBIAS) rises from 28.1% to 32.2%, and the abs(PBIAS) count leans worse (1,049 / 1,156).
Gains are largest where control over-predicts. Missouri NSE goes from −0.94 to −0.03 (PBIAS +86% to +12%), Lower Colorado from −2.61 to 0.01, Rio Grande from −1.97 to −0.38, and Lower Mississippi from 0.21 to 0.56.
On the Missouri mainstem, Hermann improves from NSE −0.39 to 0.59 and PBIAS +63.4% to +1.5%. Fort Benton, MT stays poor (NSE −8.40 to −8.01) although its PBIAS falls from +97.8% to +25.0%.
Losses are where control already has small bias, mostly along the Appalachians in the map: Ohio NSE falls from 0.44 to 0.29 (PBIAS −6.8% to −32.5%), Tennessee from 0.68 to 0.52, Mid-Atlantic from 0.33 to 0.19 and Great Lakes from 0.22 to 0.08.
Prognostic phenology. prog_phenology lowers skill on all three metrics: median NSE falls to 0.067, KGE to 0.215, and median PBIAS rises to +30.7%. NSE is materially worse at 1,235 gauges and better at 835; abs(PBIAS) is worse at 1,513. Median correlation rises from 0.642 to 0.680.
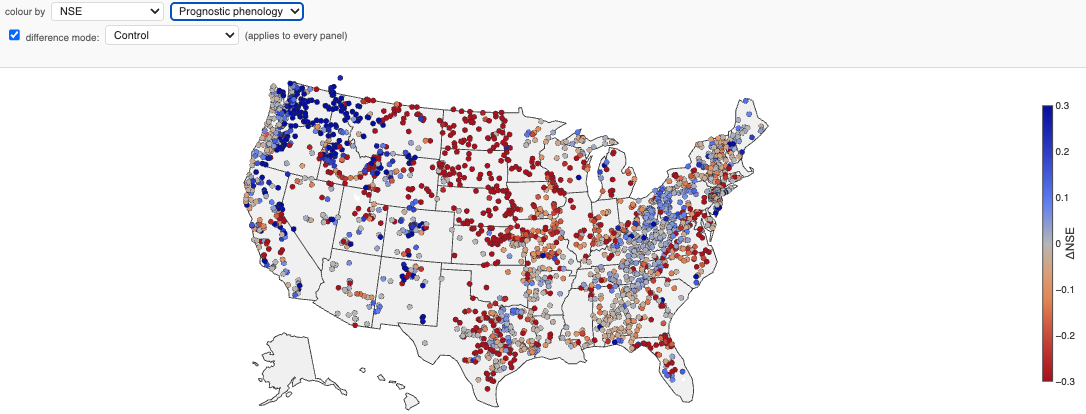
Change in monthly NSE at each gauge, prog_phenology − control. Blue is better; colours are clipped at ±0.3.
Largest losses by median NSE change: the Missouri (median NSE −0.94 to −3.43, PBIAS +86% to +164%; Hermann NSE −3.33, PBIAS +134%), Souris-Red-Rainy (0.21 to −1.84, PBIAS +230%), the Great Basin (−1.88 to −2.36) and the Upper Mississippi (0.14 to −0.11).
Gains by median NSE change: the Rio Grande (−1.97 to −1.51), the Pacific Northwest (NSE −0.22 to 0.21, KGE 0.30 to 0.48) and the Upper Colorado (−0.60 to −0.45).
By region (HUC02). Median monthly NSE, KGE and PBIAS per configuration, and gauges materially better / worse in NSE per contrast.
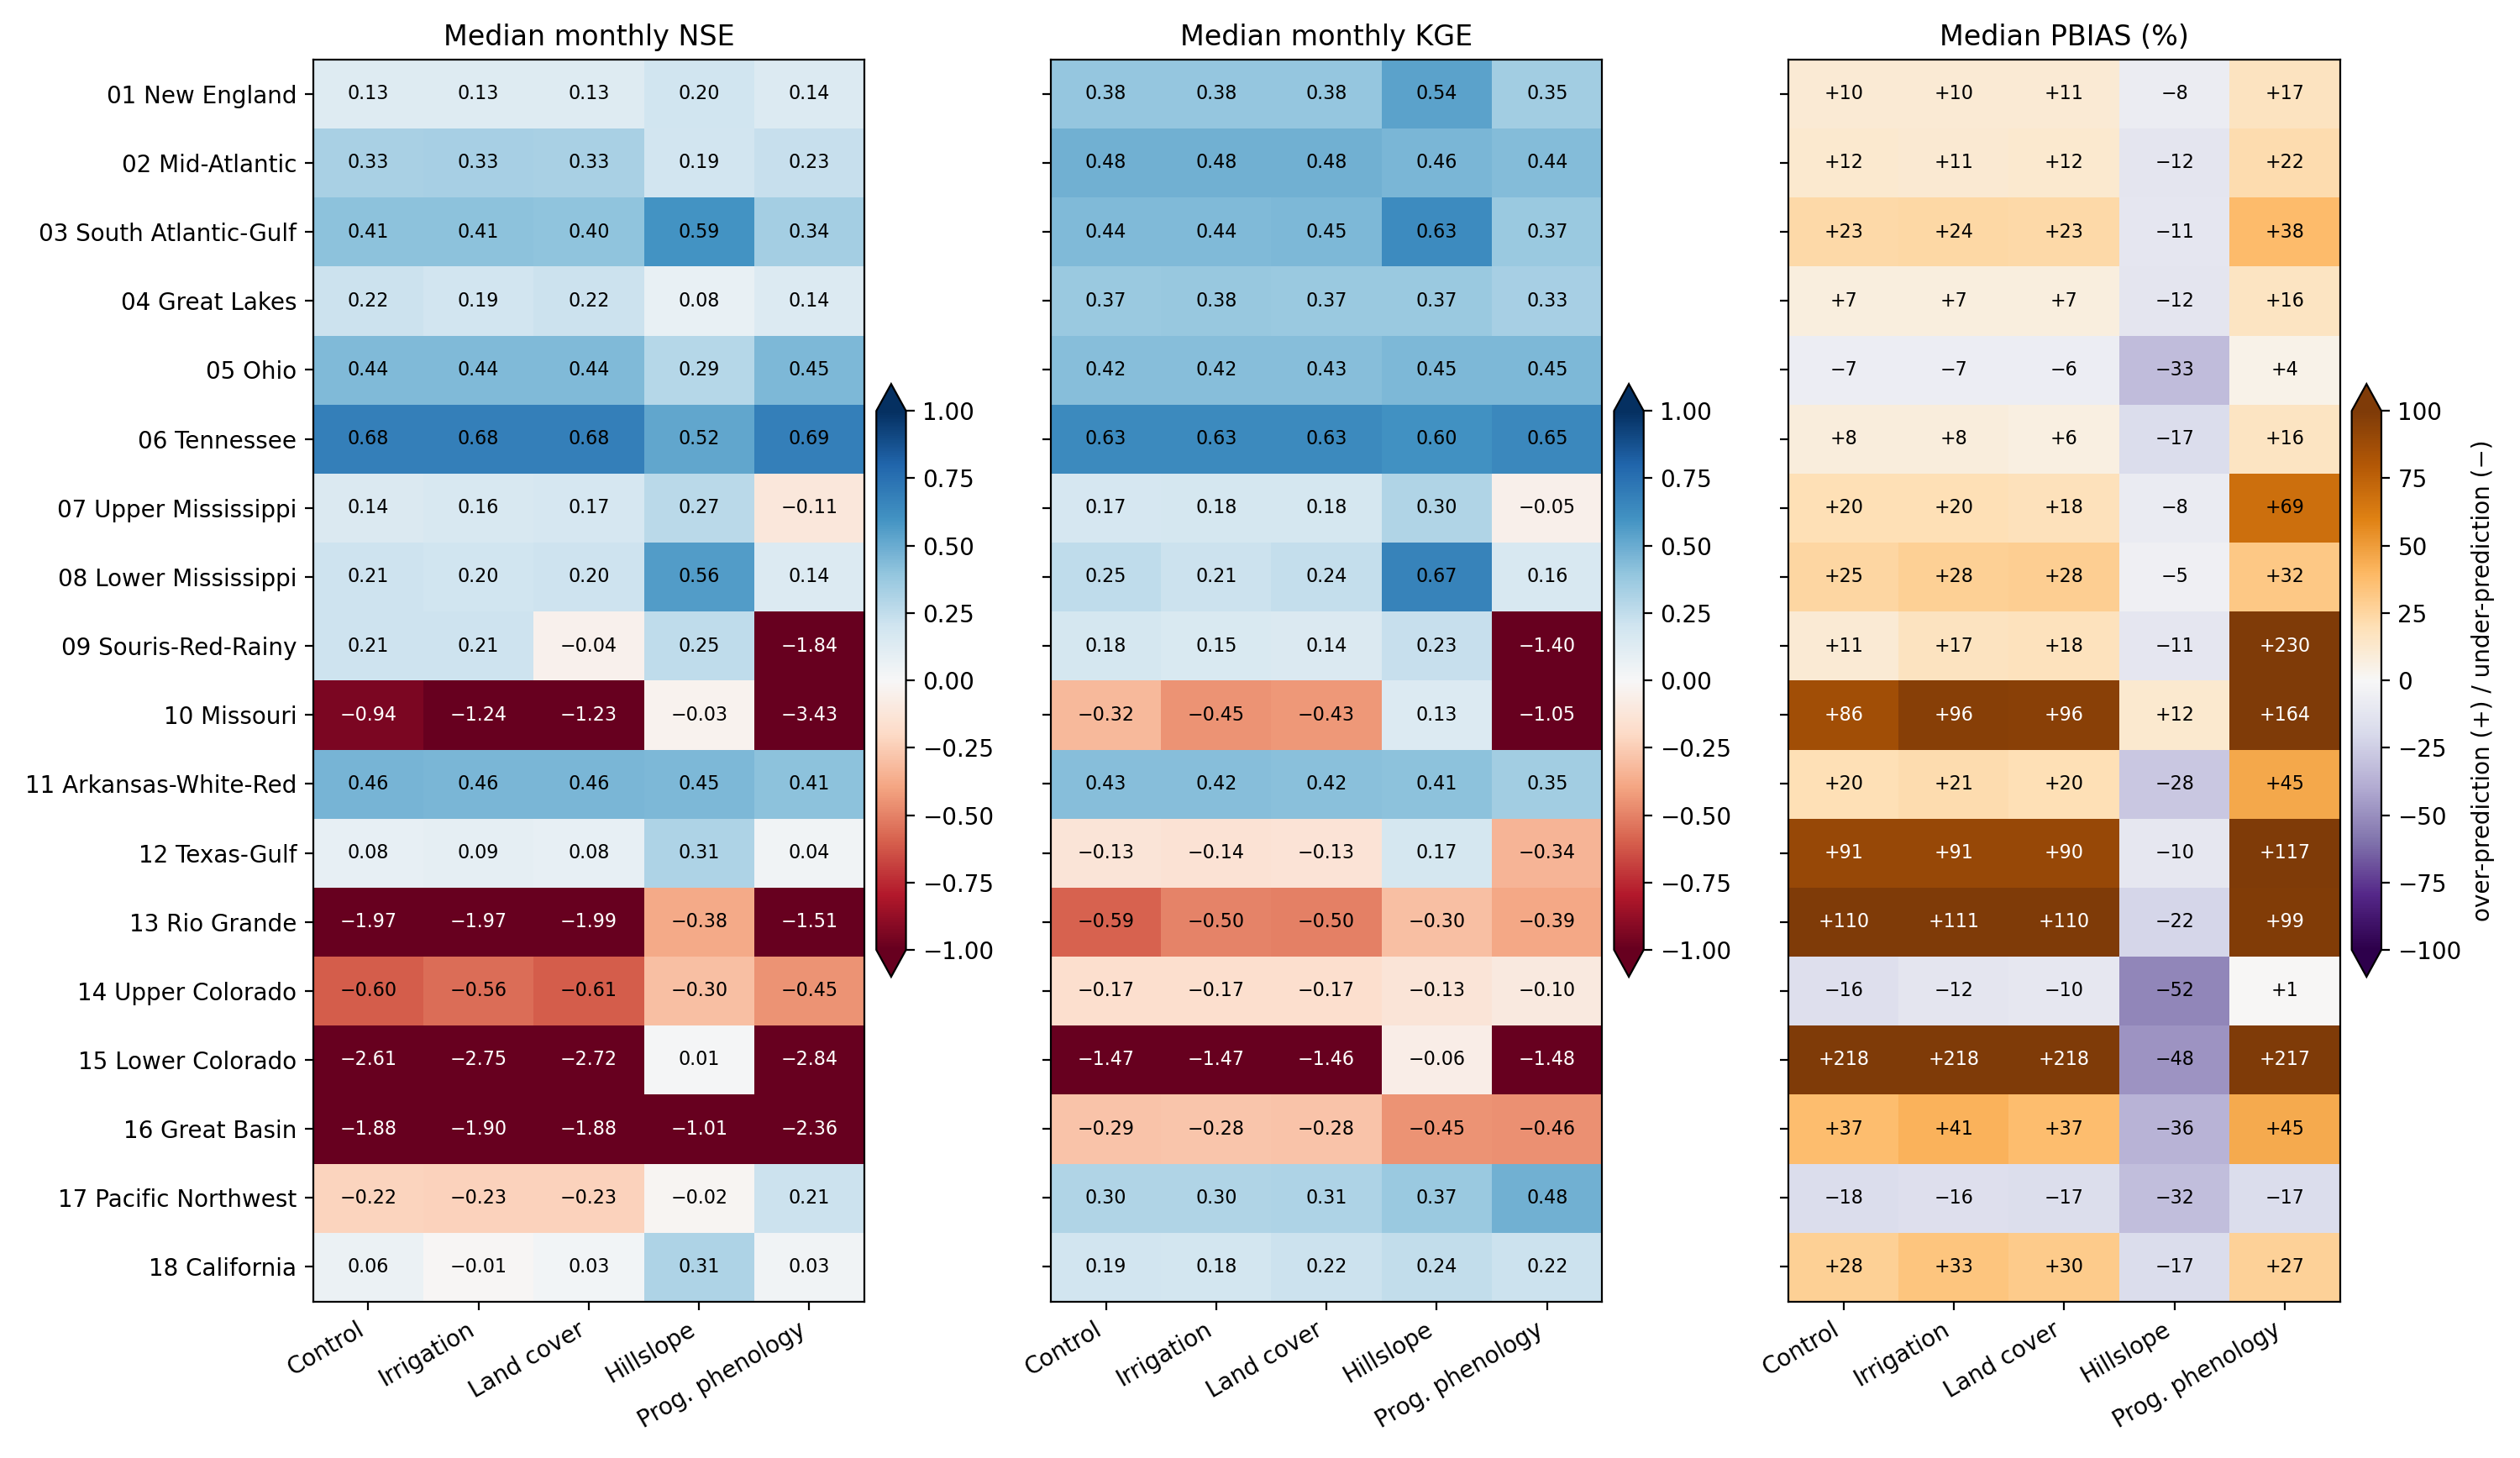
Median monthly NSE, KGE and PBIAS by HUC02 region and configuration. Cell text is the median; colours are clipped at ±1 (NSE, KGE) and ±100% (PBIAS). For PBIAS the colour shows over- (+) or under-prediction (−), not skill.
The six bar charts below show the share of each region’s gauges better (blue, right) or worse (red, left) than the contrast’s baseline; for abs(PBIAS), smaller counts as better. Material counts a change larger than 0.01 in NSE or KGE, or 1 pp in abs(PBIAS); strict counts any change. Numbers at the bar ends are gauge counts.
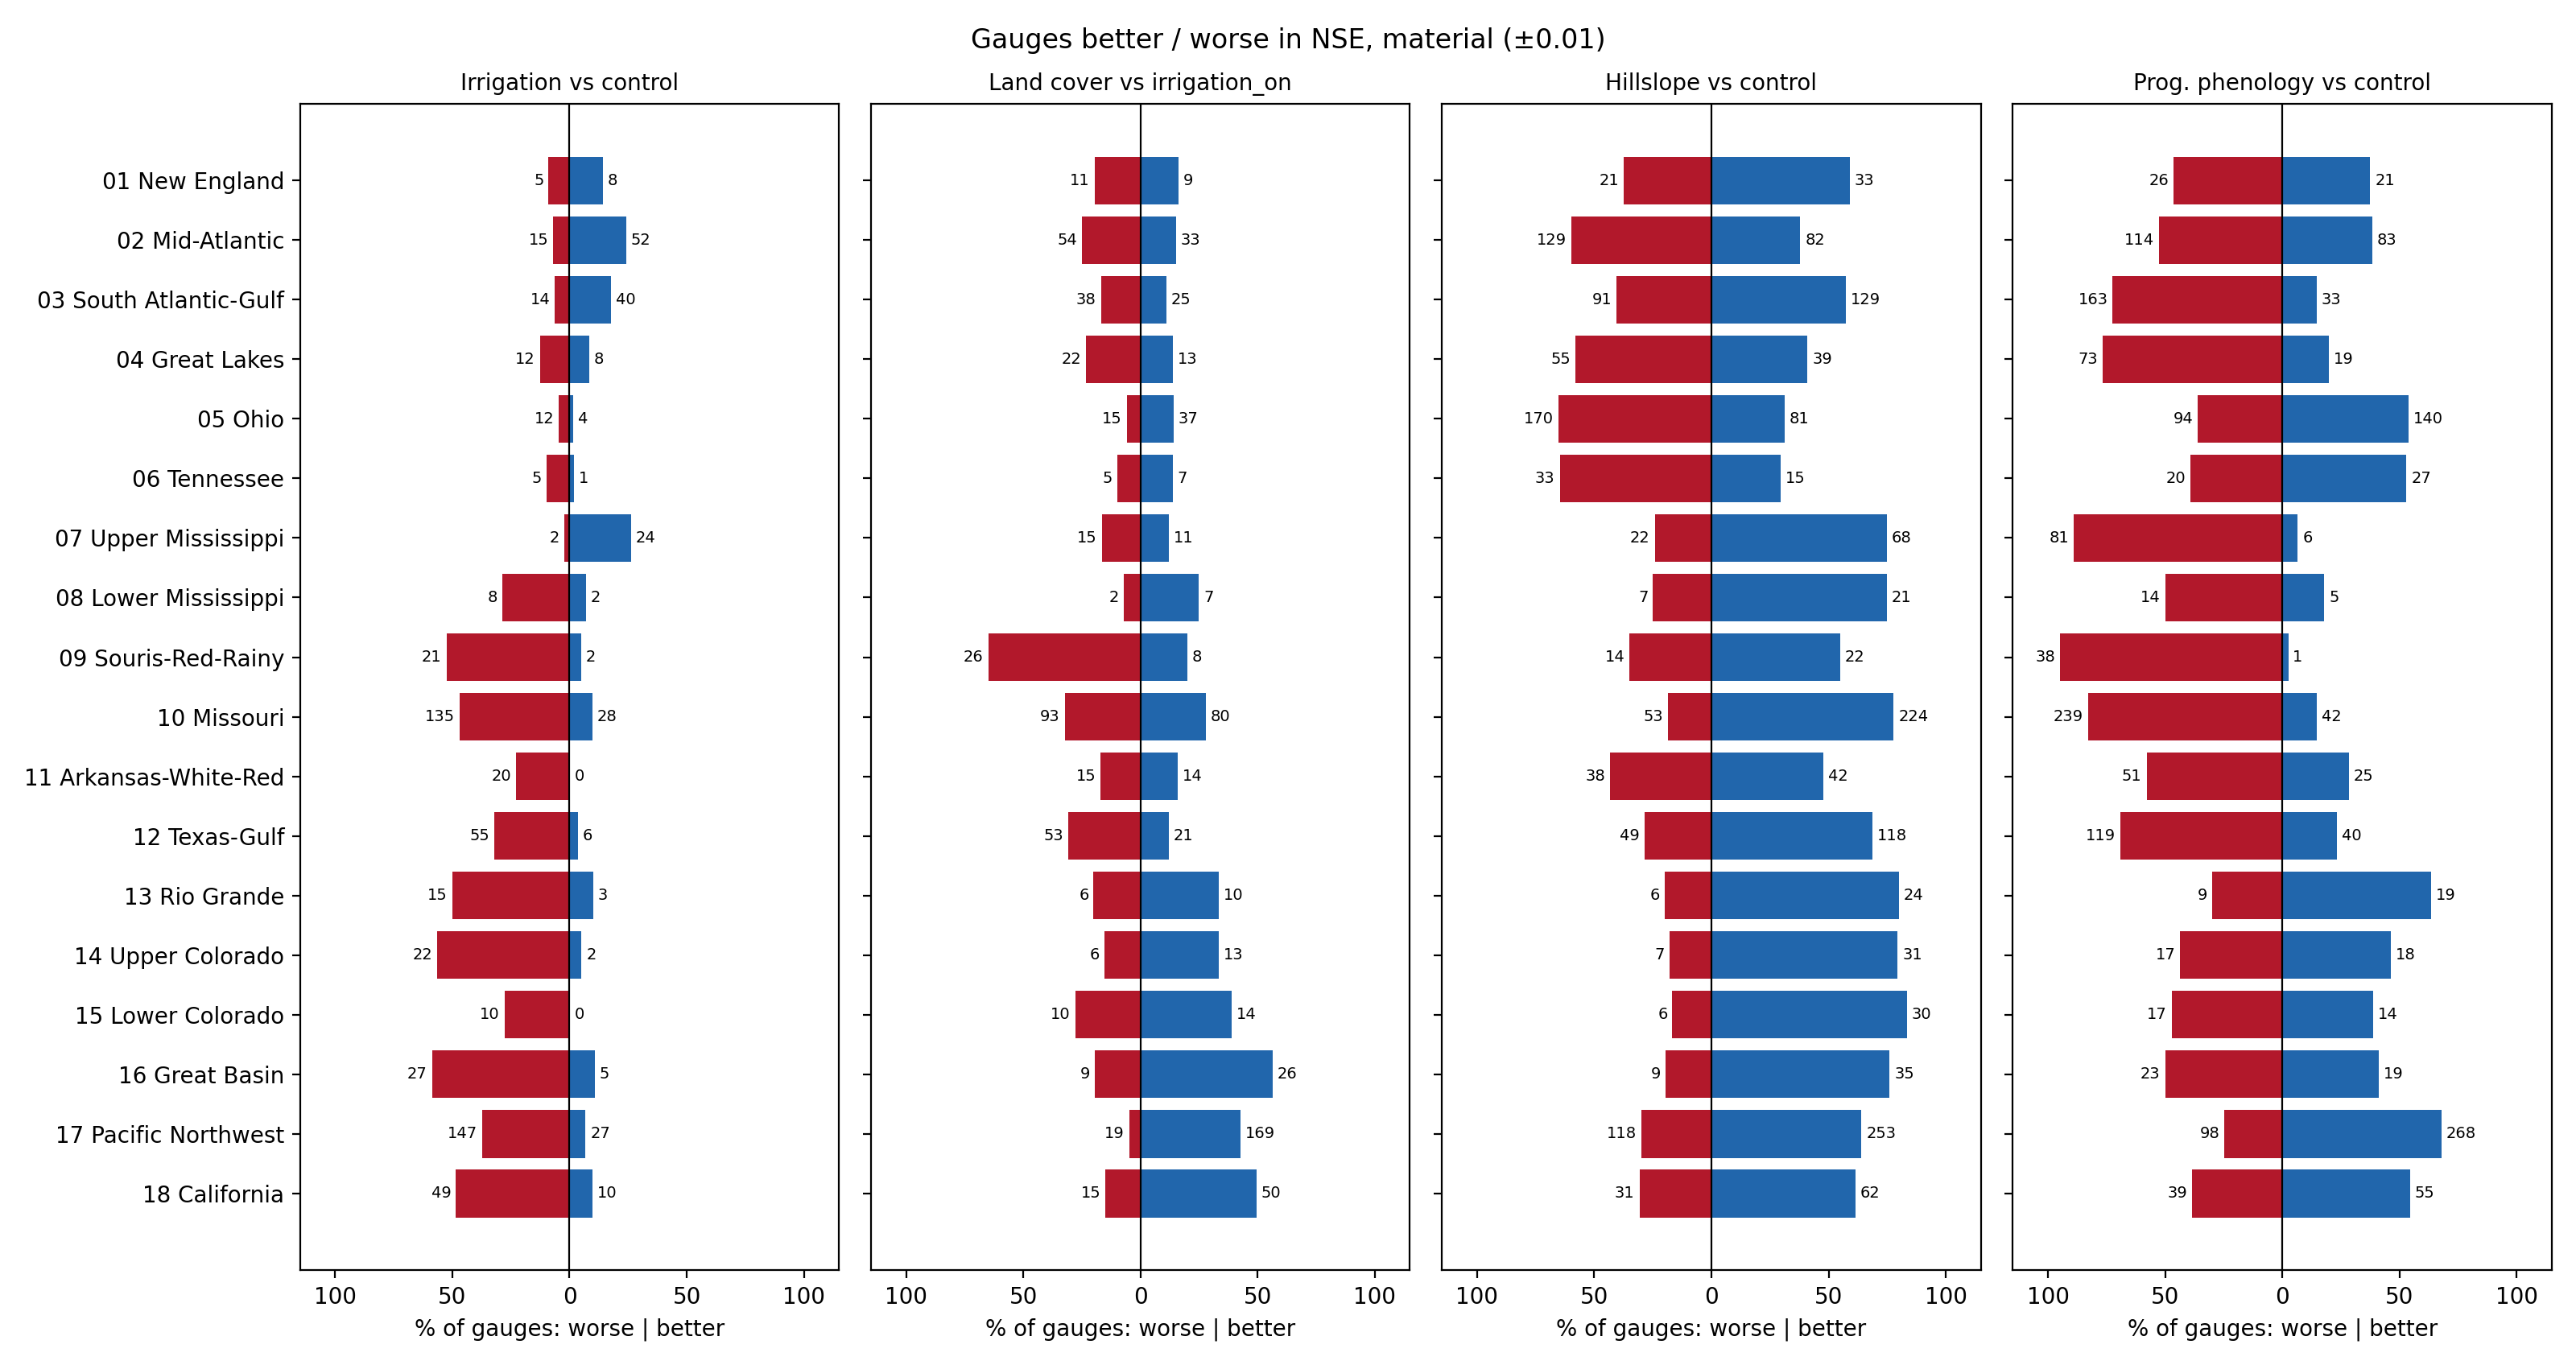
NSE, material.
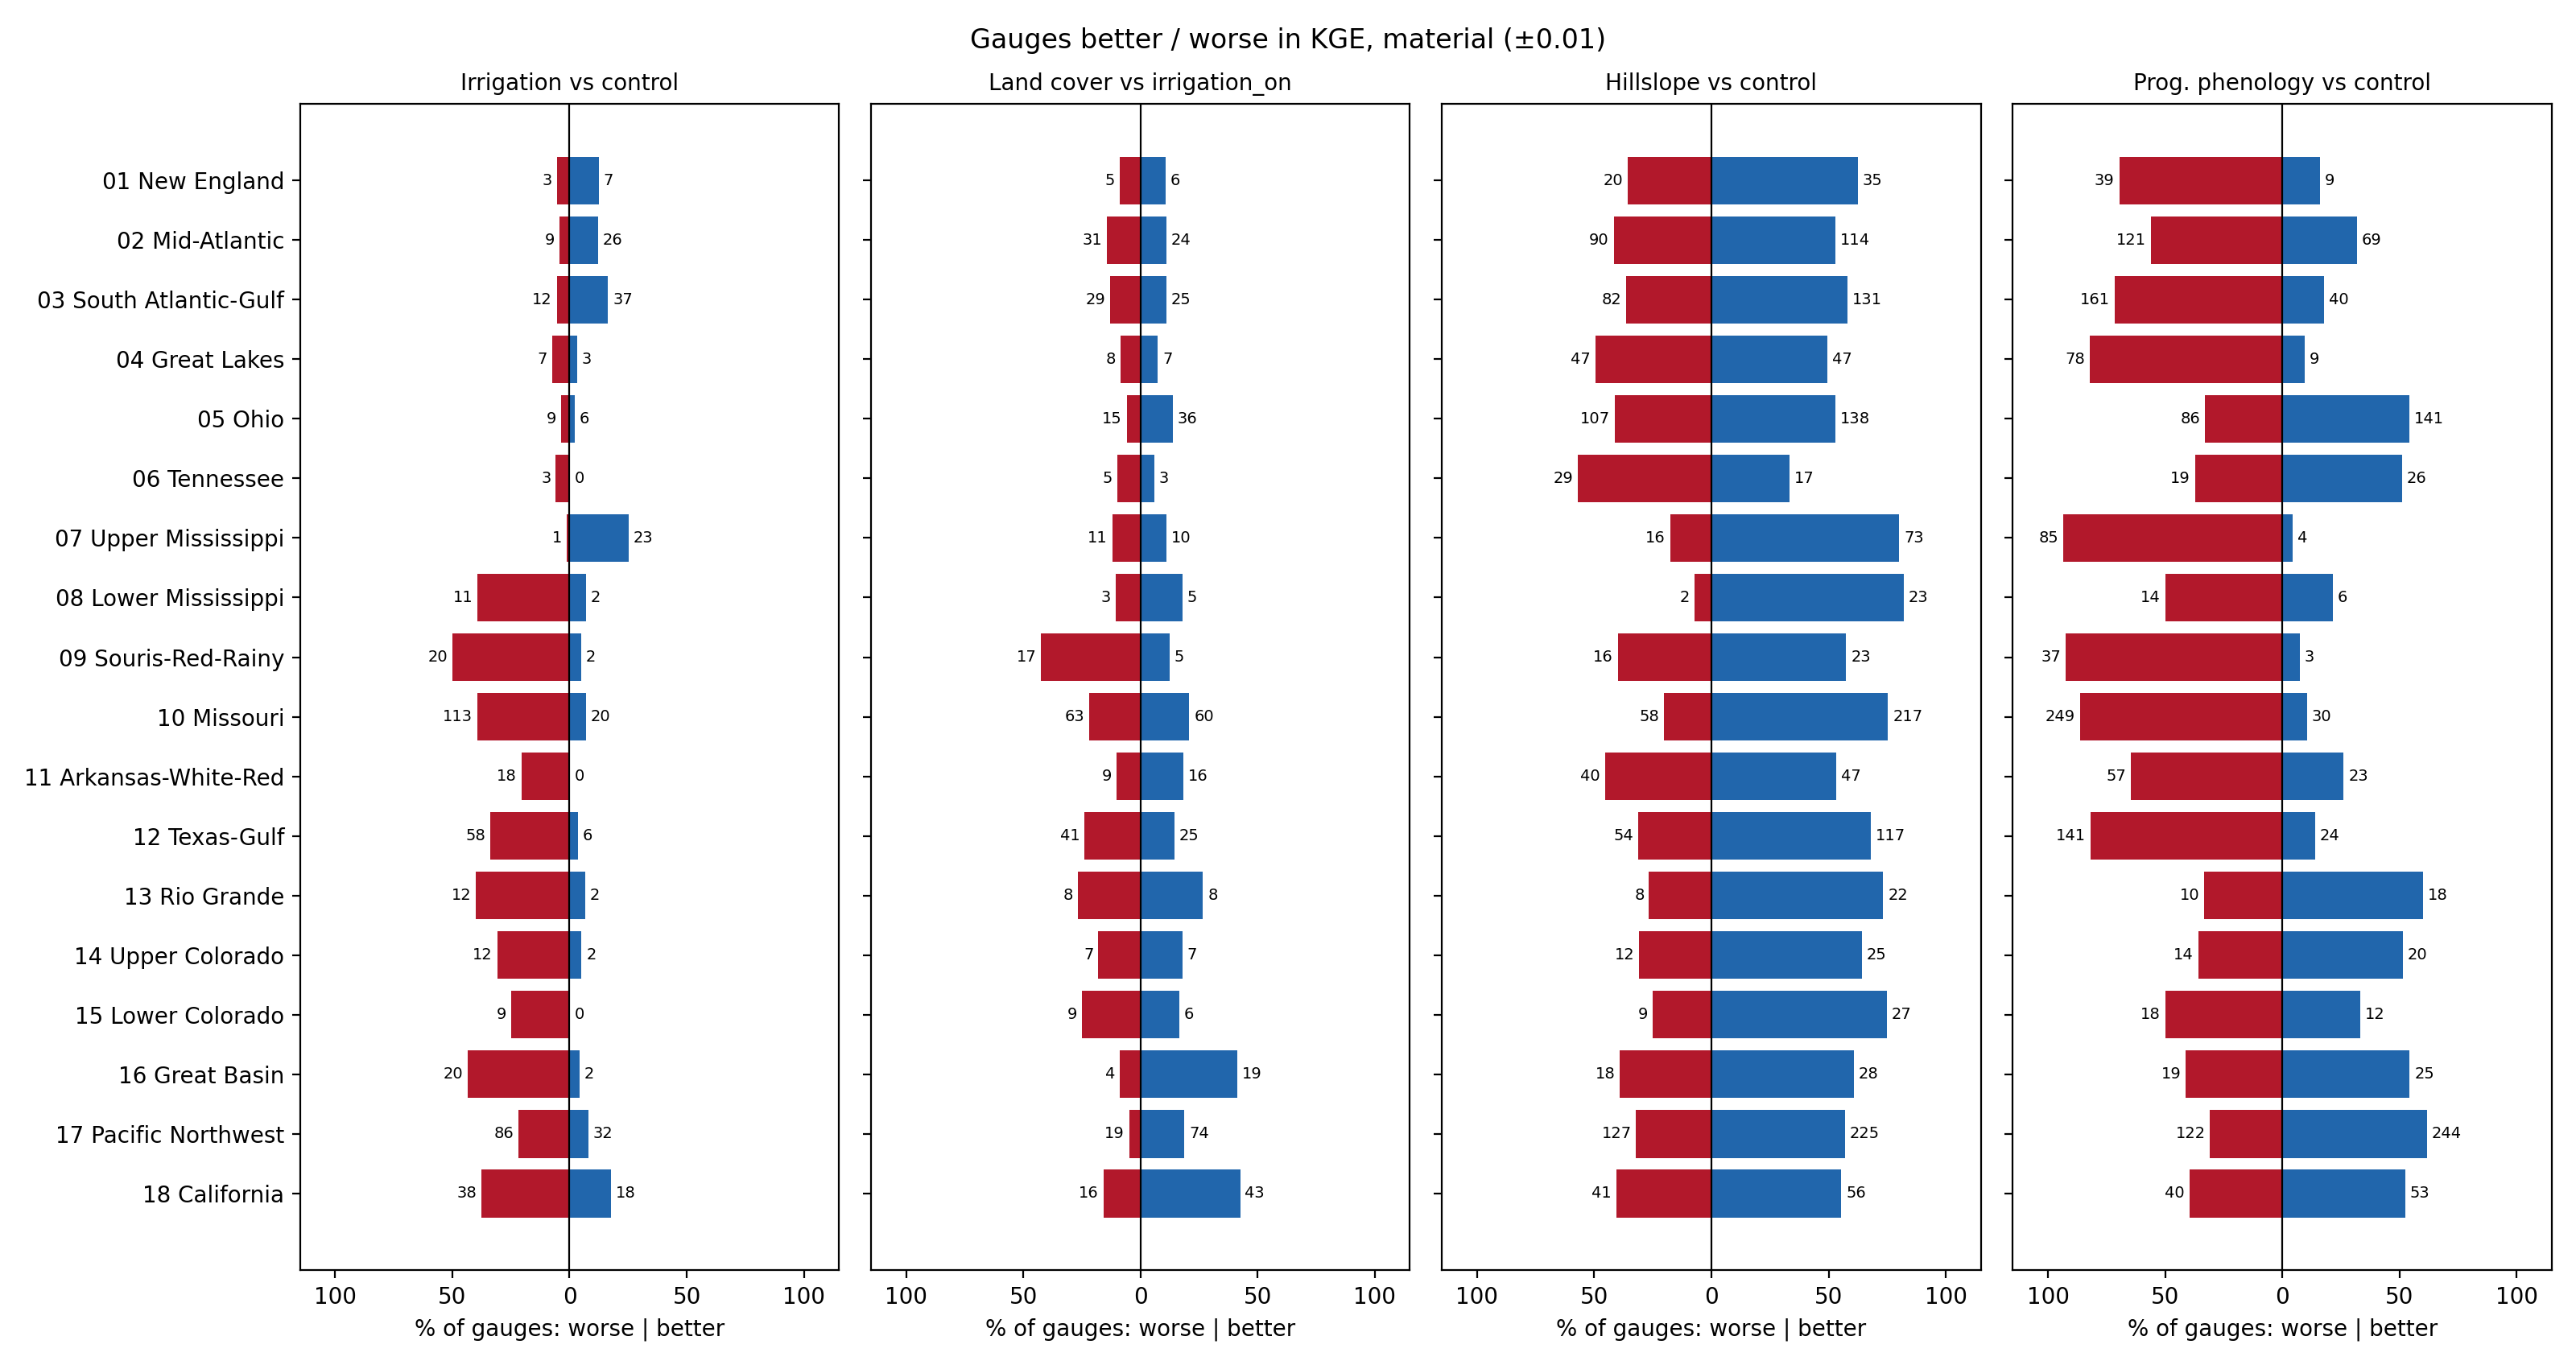
KGE, material.
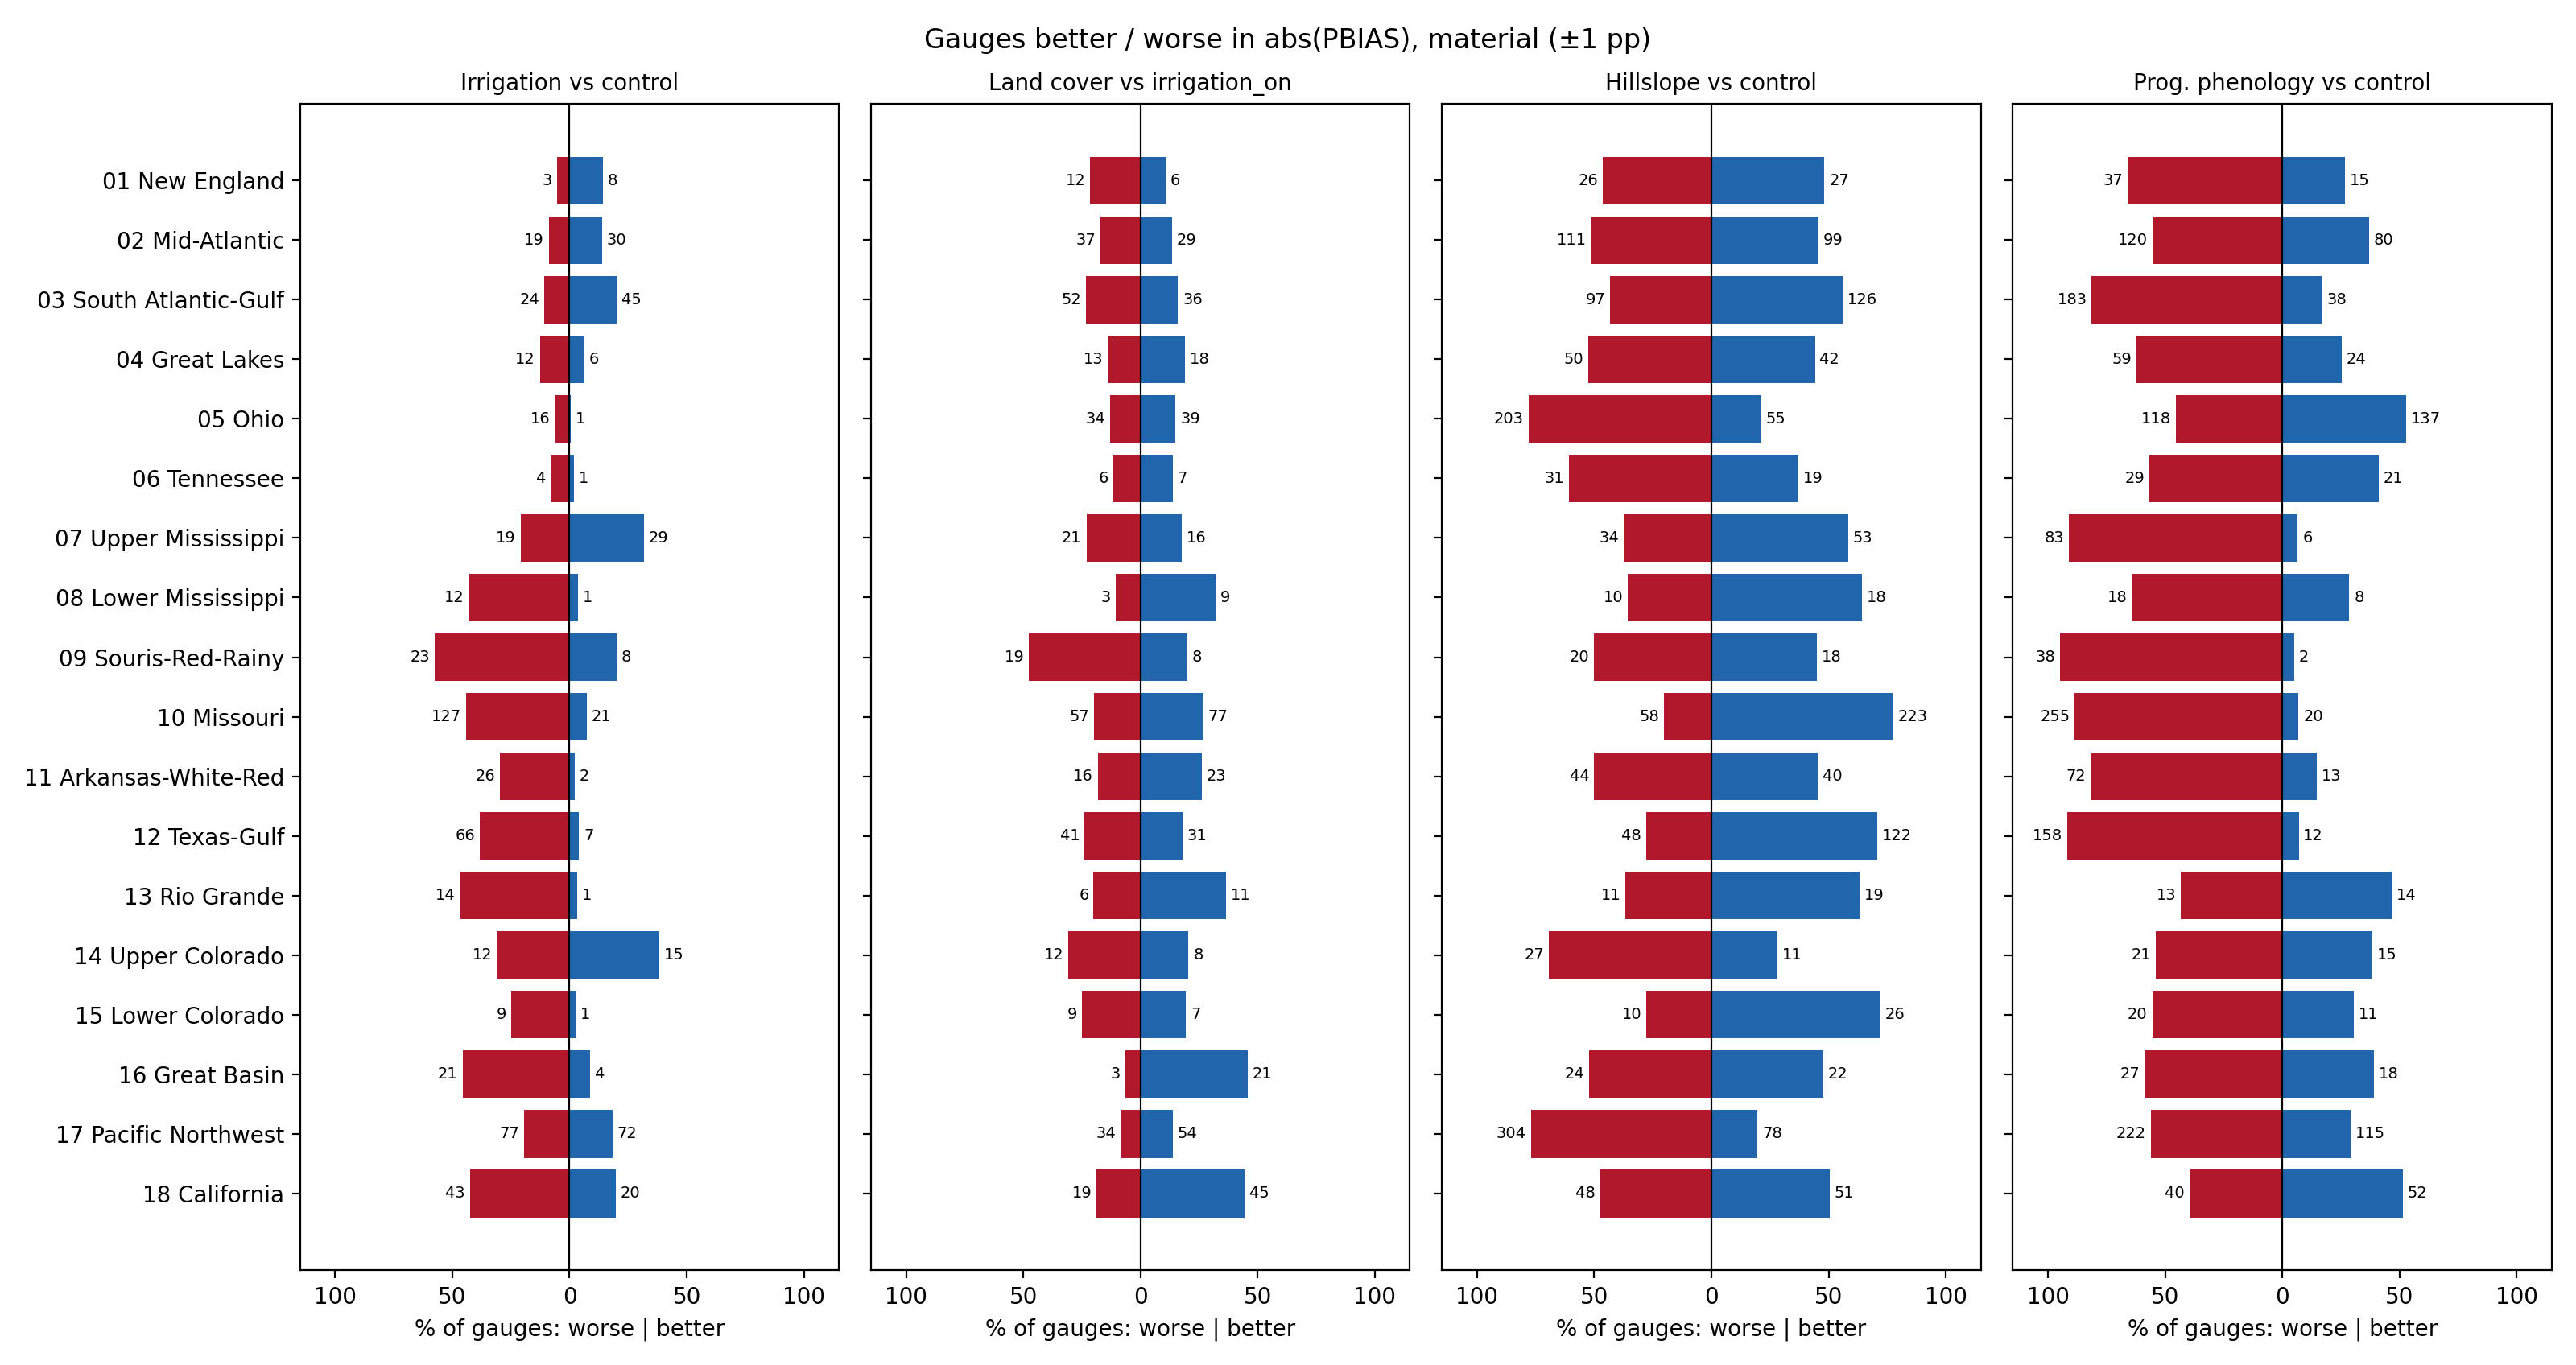
abs(PBIAS), material.
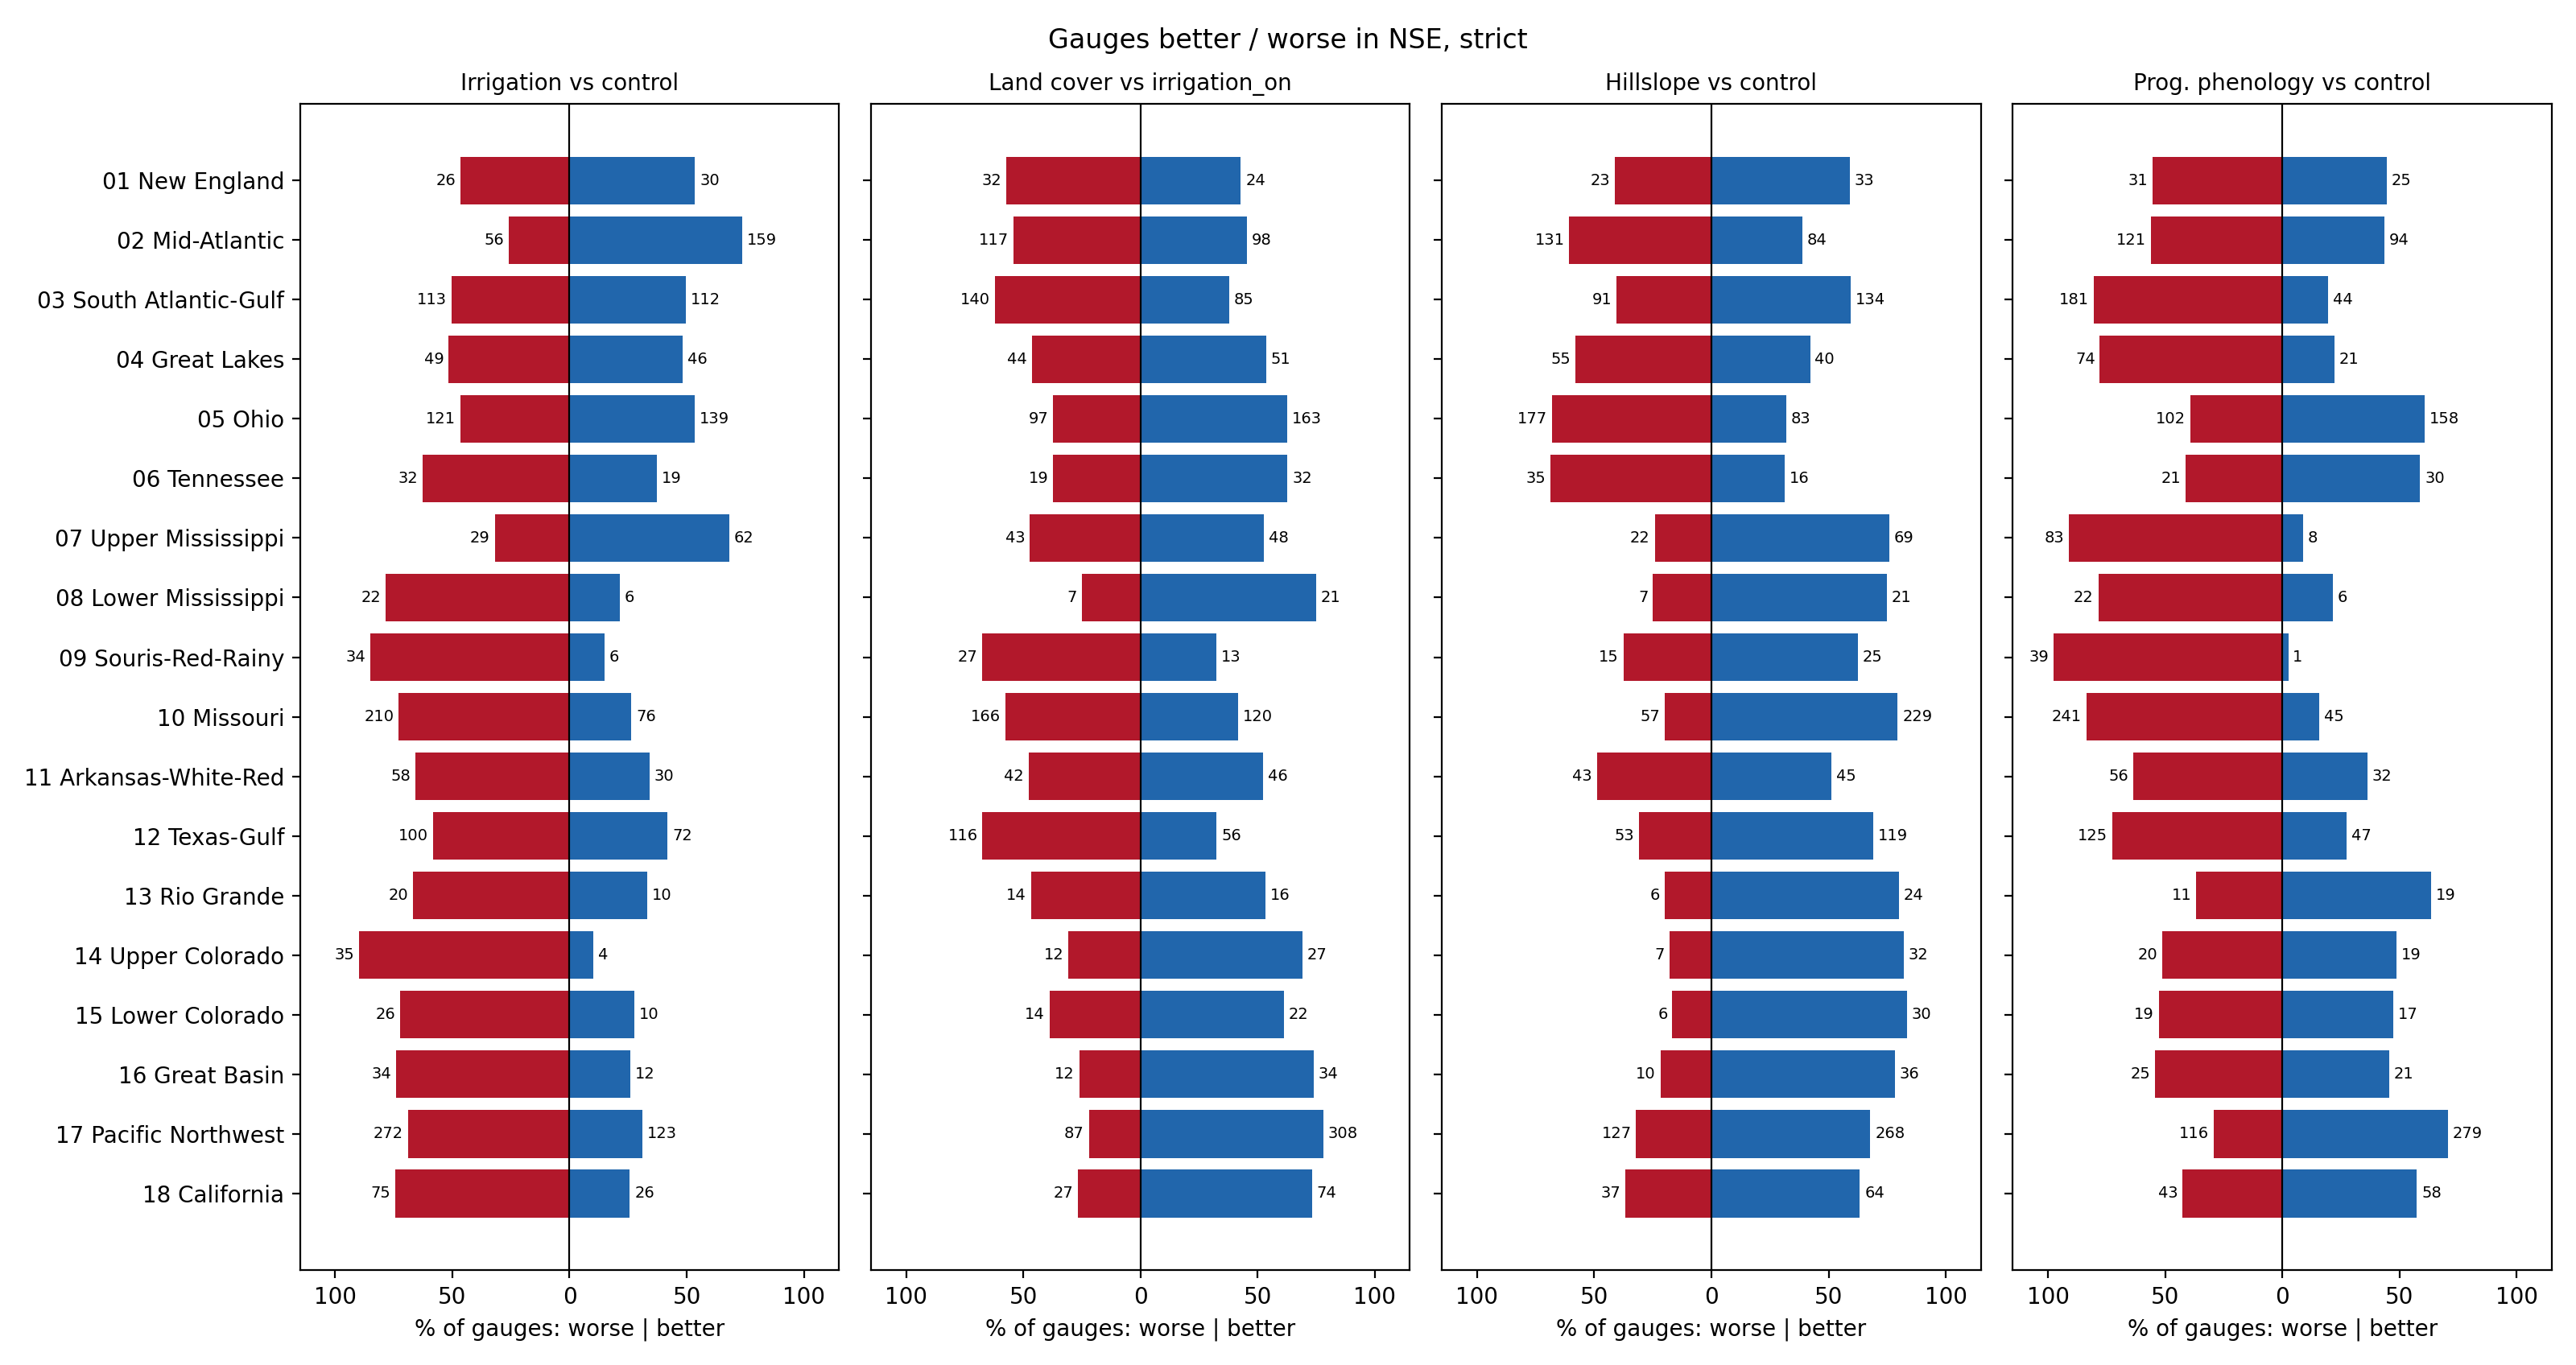
NSE, strict.
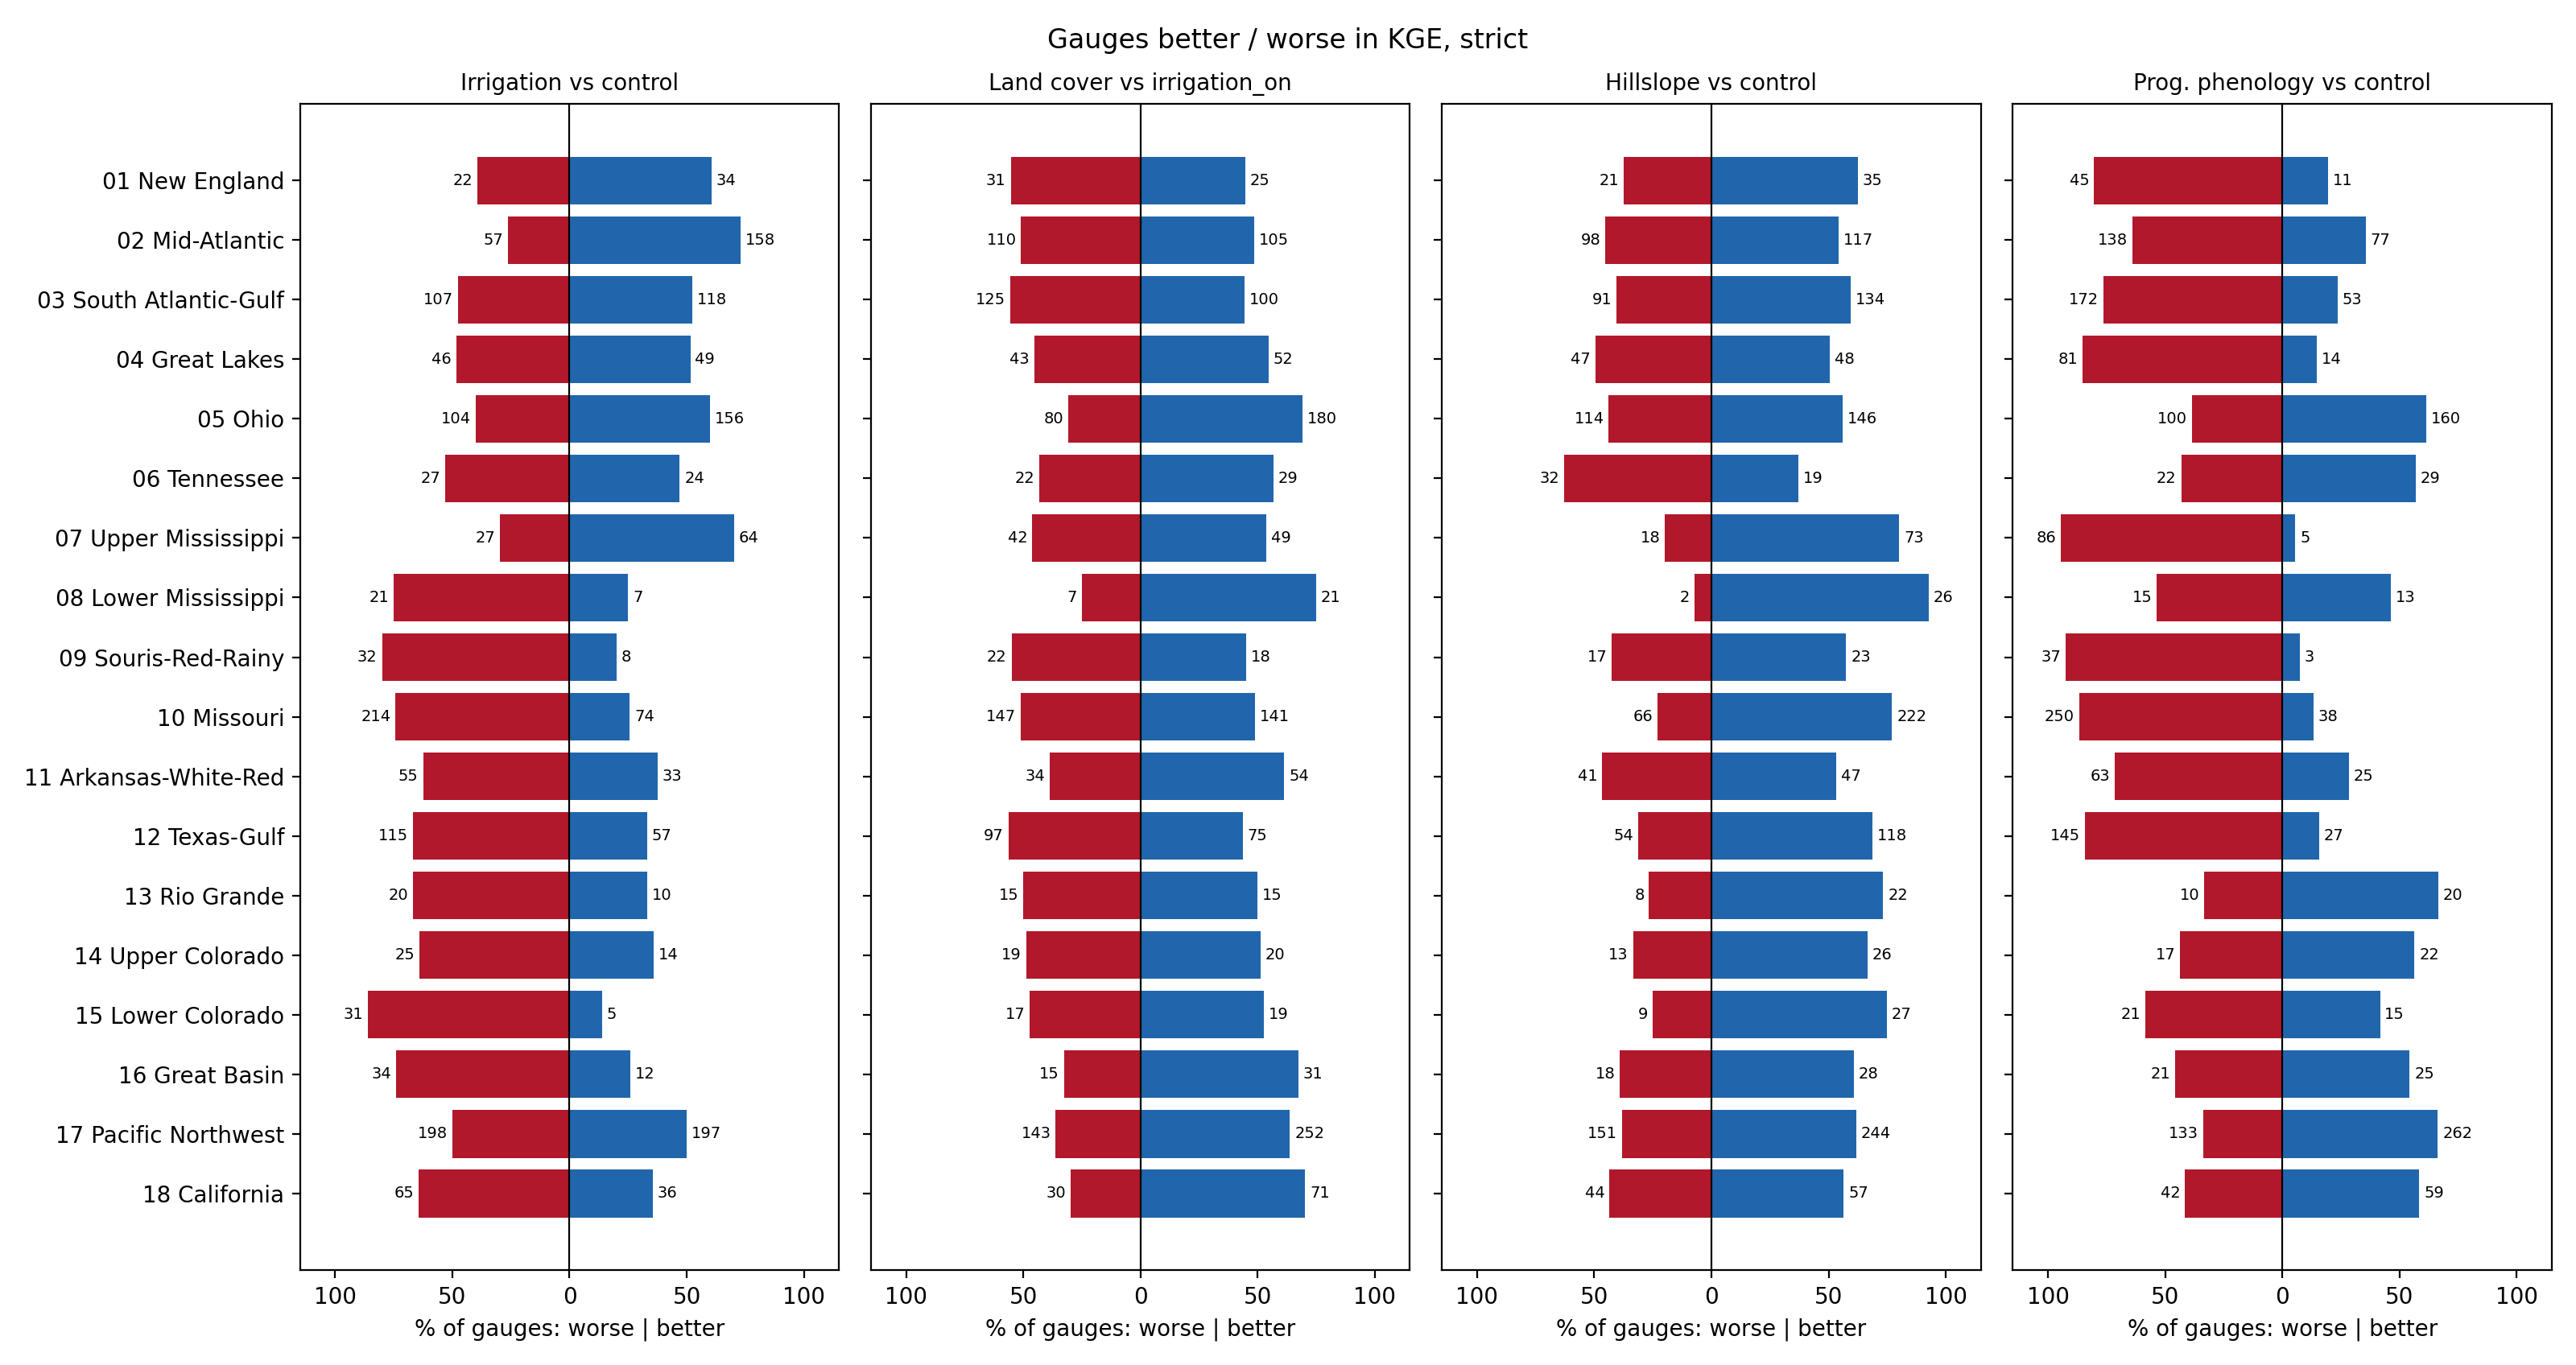
KGE, strict.
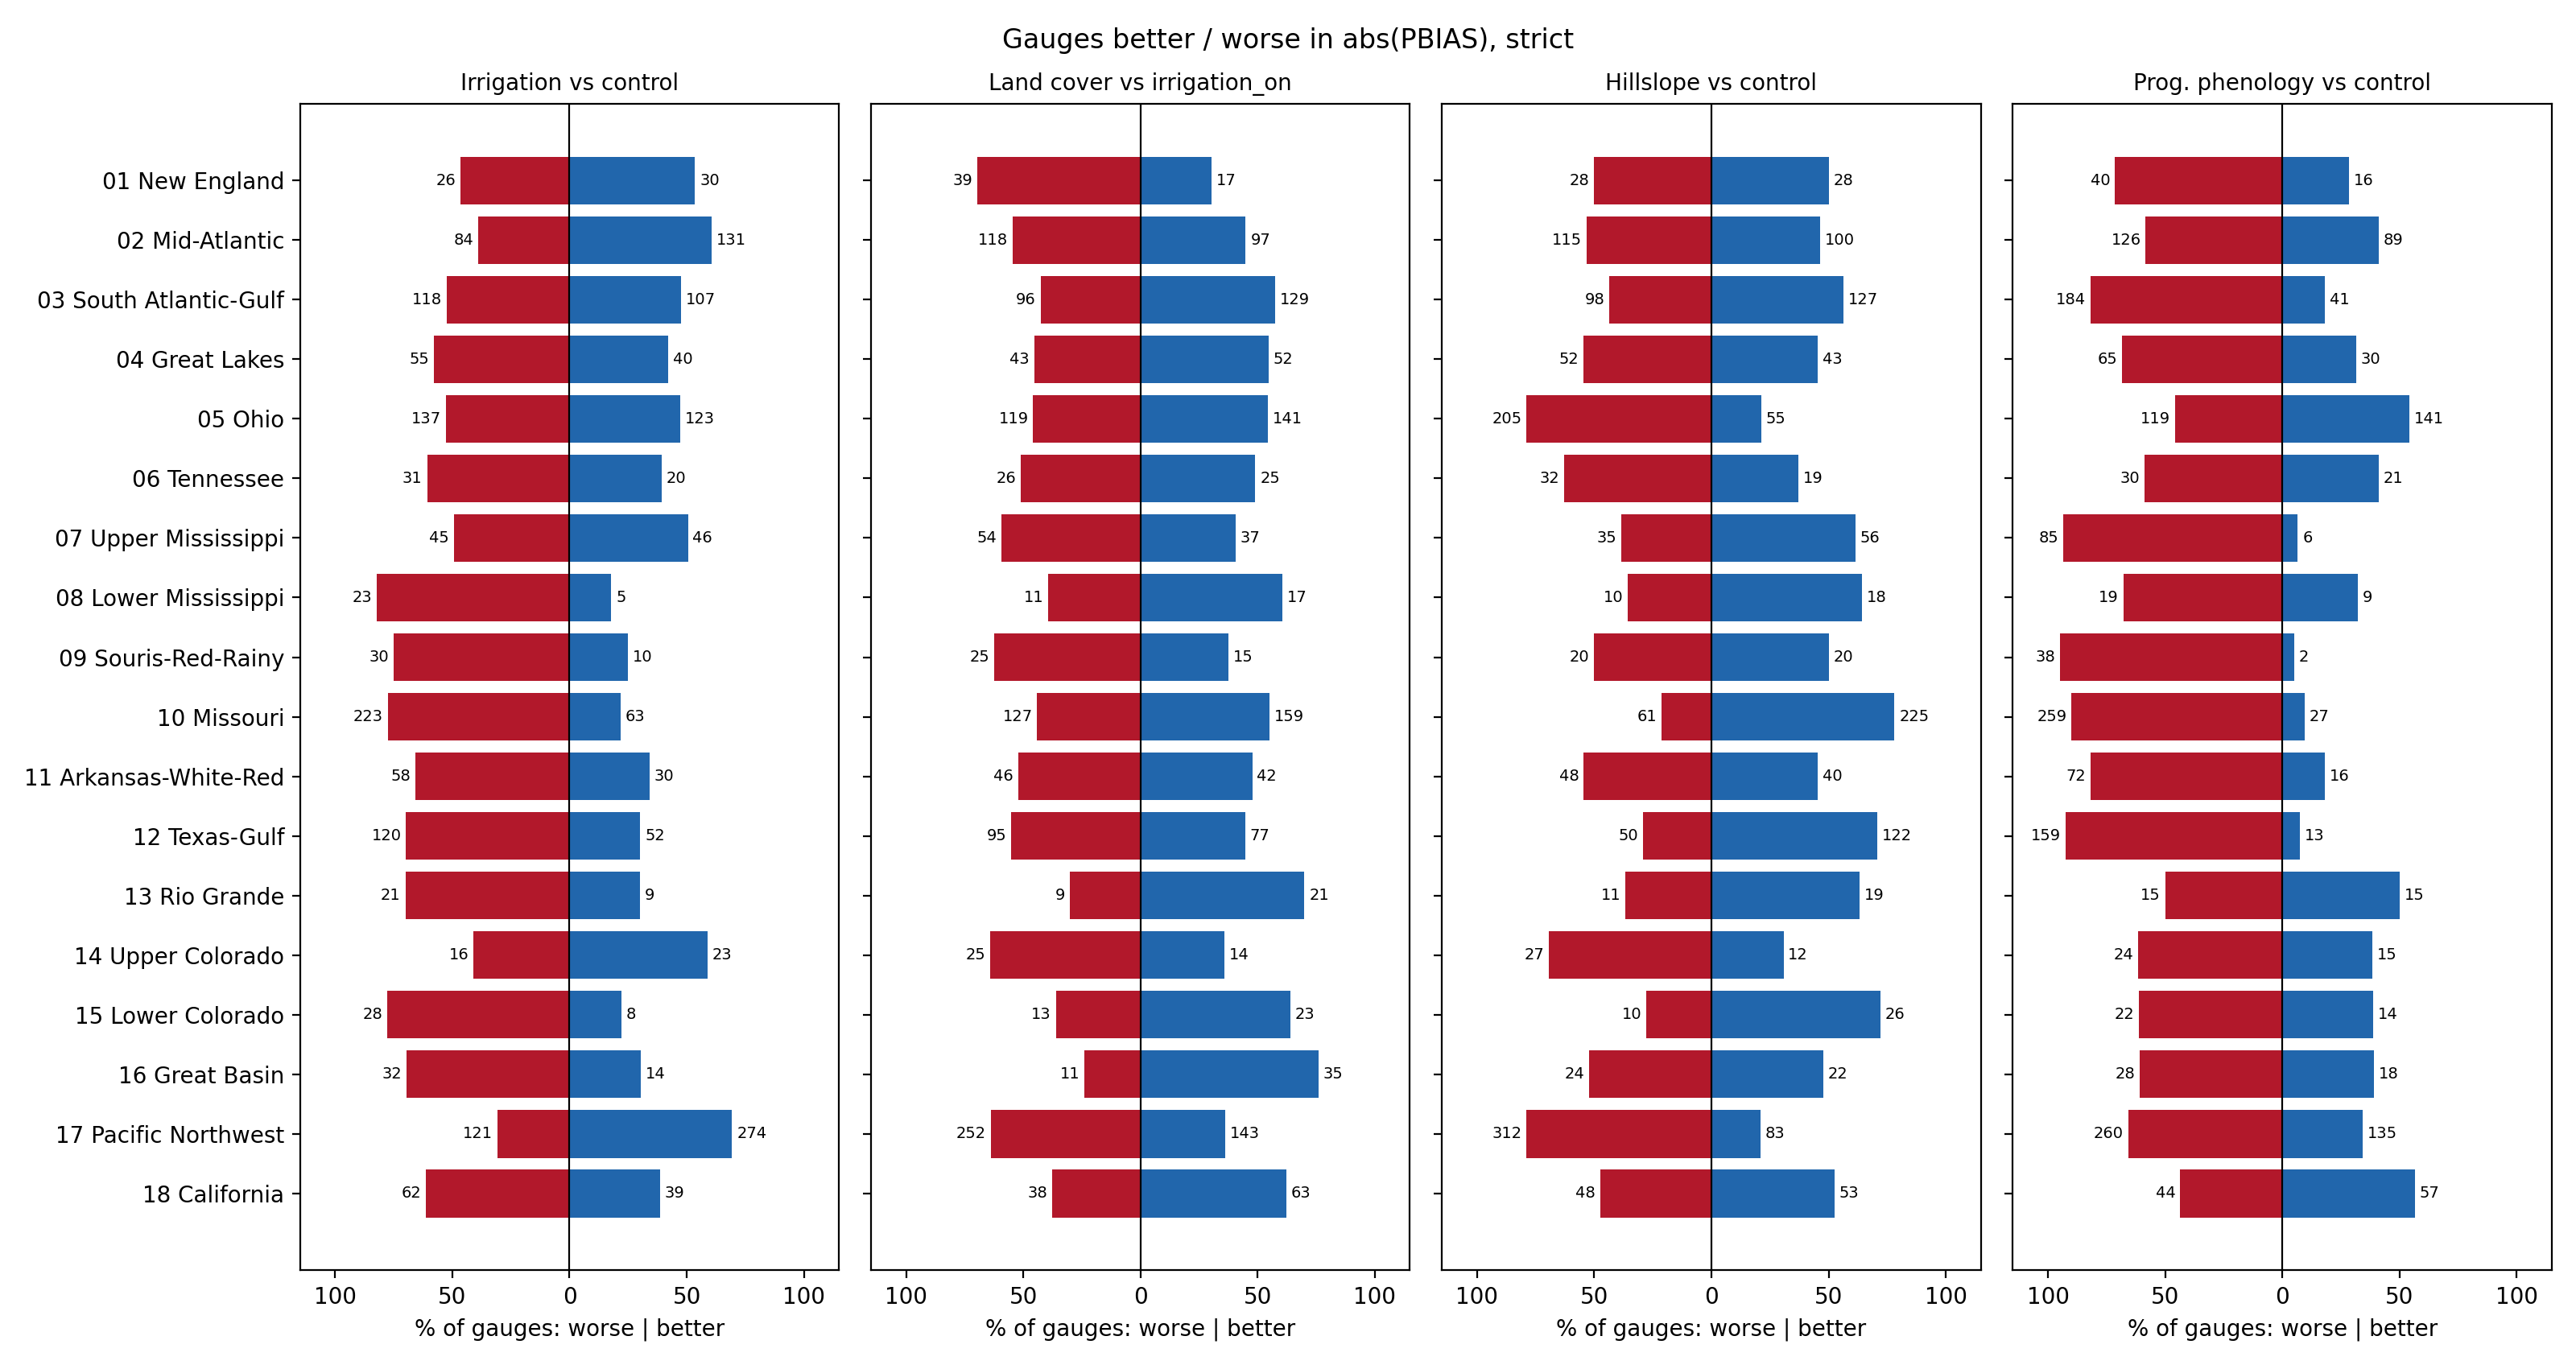
abs(PBIAS), strict.
Every regional median and count (NSE, KGE and PBIAS; strict and material) is in huc02_summary.csv, attached here (huc02_summary.csv) and on GLADE at /glade/work/mozhgana/ctsm_conus_output/report/huc02_summary.csv.