Carbon fluxes
Contents
Carbon fluxes#
%load_ext autoreload
%autoreload 2
import xarray as xr

from dask.distributed import Client

import catalog
import util

import matplotlib.pyplot as plt
import cartopy
import cartopy.crs as ccrs
import pop_tools

xr.set_options(keep_attrs=True)
/glade/work/kristenk/miniconda/envs/cesm-exp/lib/python3.7/site-packages/dask_jobqueue/core.py:20: FutureWarning: tmpfile is deprecated and will be removed in a future release. Please use dask.utils.tmpfile instead.
  from distributed.utils import tmpfile
<xarray.core.options.set_options at 0x2b7705b92d90>
Parameters#
# Parameters
casename = 'g.e22a06.G1850ECOIAF_JRA_PHYS_DEV.TL319_g17.scope_v1'
component = 'pop'
stream = 'h'

cluster_scheduler_address = None
# Parameters
casename = "g.e22a06.G1850ECOIAF_JRA_PHYS_DEV.TL319_g17.scope_v1"
component = "pop"
stream = "h"
cluster_scheduler_address = "tcp://10.12.206.26:40301"
assert component in ['pop']
assert stream in ['h', 'h.ecosys.nday1']
Connect to cluster#
if cluster_scheduler_address is None:
    cluster, client = util.get_ClusterClient()
    cluster.scale(12)
else:
    client = Client(cluster_scheduler_address)
client
Client
Client-87499e00-0c3a-11ed-a414-3cecef1b11d4
| Connection method: Direct | |
| Dashboard: https://jupyterhub.hpc.ucar.edu/stable/user/kristenk/proxy/36768/status |
Scheduler Info
Scheduler
Scheduler-59153102-2d90-4250-b1d9-5b9f28512082
| Comm: tcp://10.12.206.26:40301 | Workers: 0 |
| Dashboard: https://jupyterhub.hpc.ucar.edu/stable/user/kristenk/proxy/36768/status | Total threads: 0 |
| Started: Just now | Total memory: 0 B |
Workers
Load the data#
dsets = catalog.to_dataset_dict(
    case=casename,
    component=component,
    stream=stream,
)
dsets.keys()
dict_keys(['g.e22a06.G1850ECOIAF_JRA_PHYS_DEV.TL319_g17.scope_v1.pop.h'])
ds_grid = pop_tools.get_grid('POP_gx1v7')
lons = ds_grid.TLONG
lats = ds_grid.TLAT
depths = ds_grid.z_t * 0.01
Compute long-term mean#
ds = dsets[f'{casename}.{component}.{stream}']
variables =['FG_CO2','photoC_TOT_zint','POC_FLUX_100m']
keep_vars=['z_t','z_t_150m','dz','time_bound','TAREA','TLAT','TLONG'] + variables
ds = ds.drop([v for v in ds.variables if v not in keep_vars])
dt_wgt = ds.time_bound.diff('d2').squeeze()
dt_wgt /= dt_wgt.sum()
#dt_wgt
ds = ds.weighted(dt_wgt).mean('time')
Do some global integrals#
ds_glb = util.global_mean(ds, ds_grid, variables,normalize=False).compute()

nmols_to_PgCyr = 1e-9 * 12. * 1e-15 * 365. * 86400.

for v in variables:
    ds_glb[v] = ds_glb[v] * nmols_to_PgCyr
    ds_glb[v].attrs['units'] = 'Pg C yr$^{-1}$'

ds_glb
<xarray.Dataset>
Dimensions:          ()
Data variables:
    FG_CO2           float64 0.3532
    photoC_TOT_zint  float64 52.95
POC_FLUX_100m float64 6.654Make some maps#
### convert from mmol/m3 cm/s to mmol/m2/d
for var in variables:
    ds[var] = ds[var] * 0.01 * 86400.
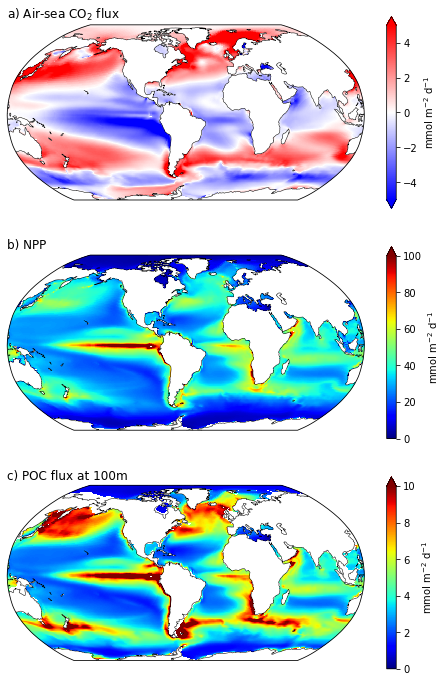
fig = plt.figure(figsize=(8,12))

ax = fig.add_subplot(3,1,1, projection=ccrs.Robinson(central_longitude=305.0))
ax.set_title('a) Air-sea CO$_2$ flux', fontsize=12,loc='left')
lon, lat, field = util.adjust_pop_grid(lons, lats,  ds.FG_CO2)
pc=ax.pcolormesh(lon, lat, field, cmap='bwr',vmin=-5,vmax=5,transform=ccrs.PlateCarree())
ax.coastlines('110m',linewidth=0.5)

cbar1 = fig.colorbar(pc, ax=ax,extend='both',label='mmol m$^{-2}$ d$^{-1}$')


ax = fig.add_subplot(3,1,2, projection=ccrs.Robinson(central_longitude=305.0))
ax.set_title('b) NPP', fontsize=12,loc='left')
lon, lat, field = util.adjust_pop_grid(lons, lats,  ds.photoC_TOT_zint)
pc=ax.pcolormesh(lon, lat, field, cmap='jet',vmin=0,vmax=100,transform=ccrs.PlateCarree())
ax.coastlines('110m',linewidth=0.5)

cbar1 = fig.colorbar(pc, ax=ax,extend='max',label='mmol m$^{-2}$ d$^{-1}$')

ax = fig.add_subplot(3,1,3, projection=ccrs.Robinson(central_longitude=305.0))
ax.set_title('c) POC flux at 100m', fontsize=12,loc='left')
lon, lat, field = util.adjust_pop_grid(lons, lats,  ds.POC_FLUX_100m)
pc=ax.pcolormesh(lon, lat, field, cmap='jet',vmin=0,vmax=10,transform=ccrs.PlateCarree())
ax.coastlines('110m',linewidth=0.5)

cbar1 = fig.colorbar(pc, ax=ax,extend='max',label='mmol m$^{-2}$ d$^{-1}$');